How to Create Your First Sales Report in Power BI with Your CRM Data


The current trend of automation in business management also applies to business analysis. Business Intelligence in the form of Microsoft Power BI replaces dozens and hundreds of hours work in Excel. The best thing is that you can easily make automatic reports yourself. See how to create your first business report in Power BI with data from a CRM system.
Managers have always needed reports for their work: detailed, clear, accurate, and last but not least, up-to-date. The boss, who gets angry at the assistant because they didn't give a printed report on his/her desk in the office, appeared in so many movies and series that you will probably recall that too. Thanks to Power BI, however, the idea for similar scenes will probably make no sense in the future.
The image of a modern manager looks rather different. Today's ideal is reports in cell phones available on the train on the way to work or on a tablet on the beach during a long vacation in Thailand. However, travel restrictions are not the only obstacle to make these ideas come true.
Although everyone can work with good old Excel, Power BI meets the current demands of automatic and available reports much better. If you face the Power BI vs. Excel decision, the younger of Microsoft's analytics tools is the step towards innovation.
Up-to-date repost available at anytime from anywhere
The Power BI interactive dashboard environment allows you to visualize actually any business data. Tables, graphs and other report formats can be viewed in detail from many perspectives. Unlike Excel, however, very intuitively, on any device, and always with up-to-date data.
Data freshness is one of the main advantages and basic principles on which Power BI is based. The reports obtain data from integrated systems, such as a CRM, which will be discussed. However, old habits die hard and many companies do not want to switch to more modern technology out of a reluctance to learn how to use new software.
Creating a new report in Power BI can be more time consuming than in Excel, but in the end, you will save time anyway, because unlike Excel, you do not have to constantly create new reports or update data. So let's create the first sales report in Power BI about sales reps, companies and products. We will use data from billing in eWay-CRM.
Starting communication between Power BI and eWay-CRM
The very first step is to set up communication between Power BI and eWay-CRM. In the Power BI start menu, select Get data, locate the eWay-CRM connector and connect to eWay-CRM. In the Navigator, then select Companies, Bookkeeping, Products in Bookkeeping Record, Drop Down Menu Values, and Users tables that contain data with customers, users, documents and their items, and code lists.
In the next step, the table data is displayed and needs to be linked. We are getting to a drag-and-drop connector, which is actually quite fun. So, start by dragging the CompaniesCustomerGuid column from the Bookkeeping module to the ItemGUID column in the Companies table. And go on. To complete the complete connector just do the following:
| ↔ | |
| Bookkeeping Companies_CustomerGuid | Companies ItemGUID |
| Bookkeeping TypeEn | Drop Down Menu ItemGUID |
| Bookkeeping ItemGUID | Products in Bookkeeping Record Carts_GoodsInCartGuid |
| Companies OwnerGUID | Users ItemGUID |
By connecting the individual table items, you will make links between the eWay-CRM modules. You will use other columns or tables when creating additional reports. Feel free to contact us, we are happy to advise you on setting up communication between Power BI and eWay-CRM.
TIP: In case you are not using eWay-CRM yet we recommend you to book a demo and discuss the reports in your company.
Creating a report
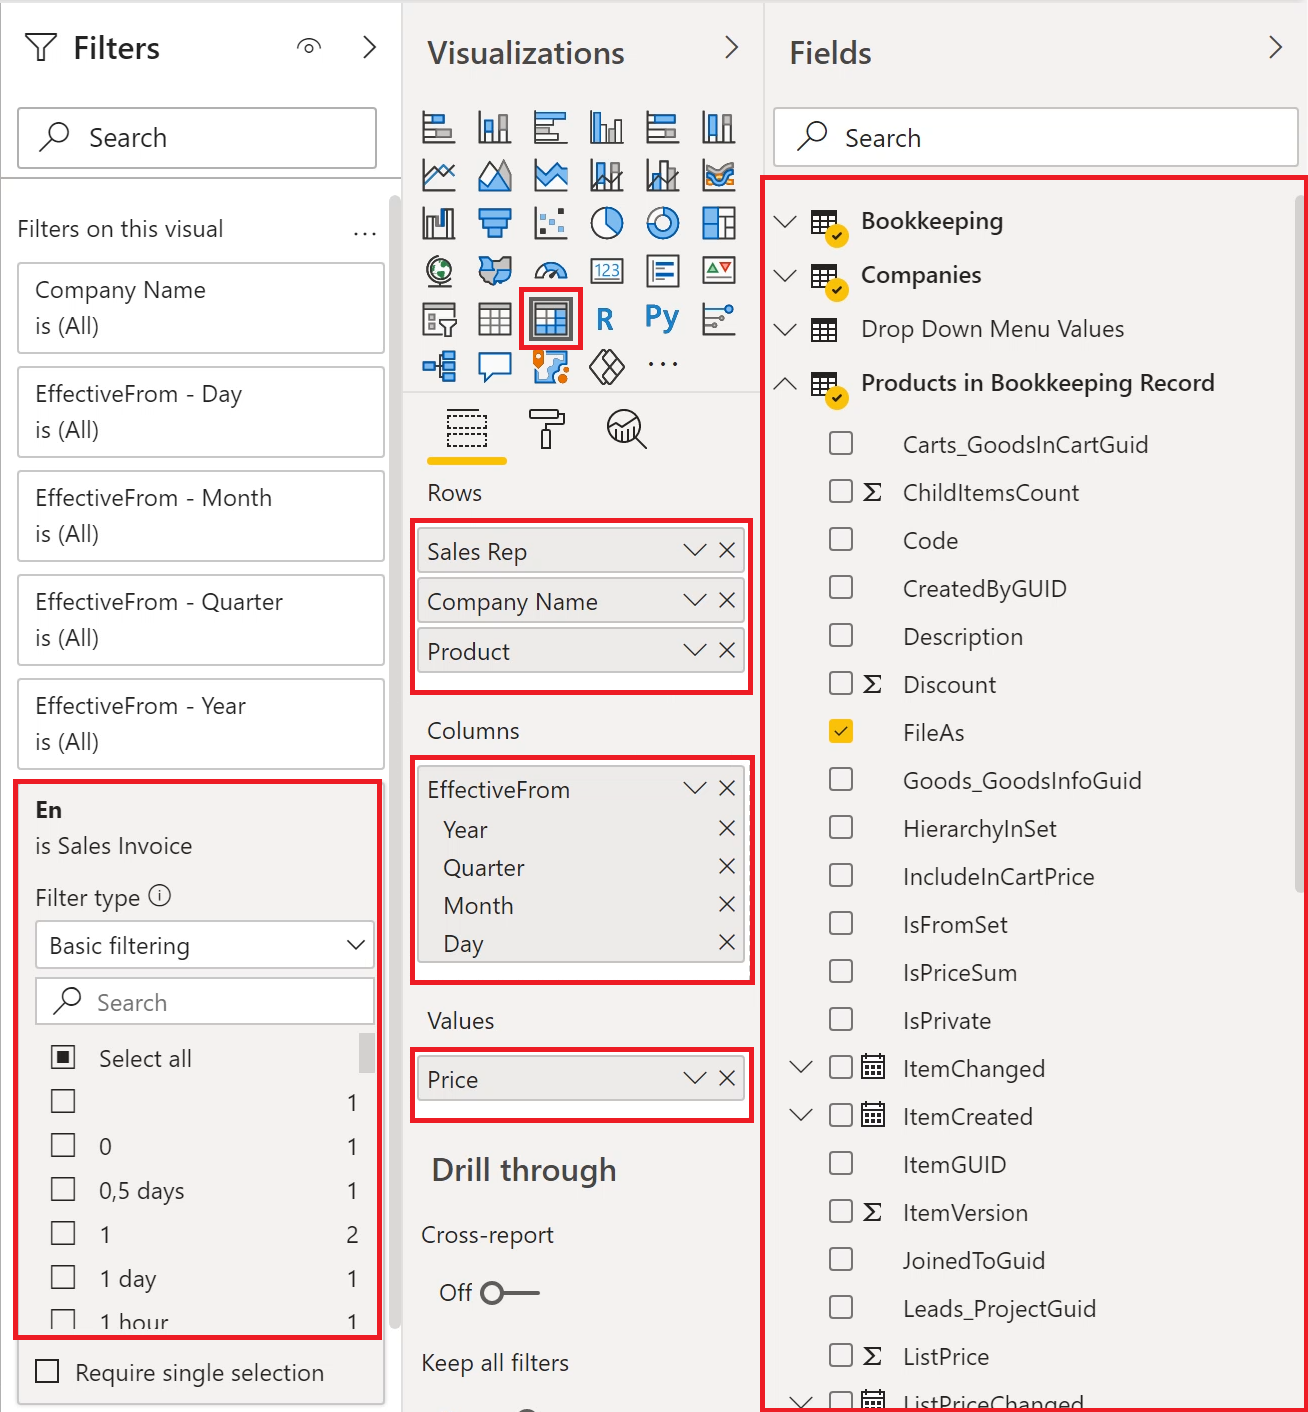
Now that the tables are properly linked, switch to Power Reporting Control Panel in Power BI. In order to create a sales table, select the Matrix option in the Visualizations section. We then fill the resulting template with the prepared data from eWay-CRM, which is located in the right section of the Field.
We will gradually move the data fields to the space for Rows, Columns and Values, where we can rename them into a more user-friendly language. Therefore, in order to be able to track sales by sales reps, insert FileAs from Users in the Rows and rename it to Sales Rep. Thanks to this, we will see the profits distributed among the individual sales reps in the table.
We will add sales by company to the table in the same way. From Companies, drag FileAs to Rows and rename them Company Name. For a change, this will allow us to find out which clients bring our company the biggest profits.
To get a third perspective on product sales, we'll use FileAs from the Products in Bookkeeping Record table. We then name this the Product. We will immediately see which products have entered the company's cash register with the largest amount.
Next, we enter the date of issue of the invoice or the taxable supply date in the Columns, which can be found under the Bookkeeping table as EffectiveFrom and TaxableSupplyDate. We will have sales divided by days, months or other time periods as needed.
And in Values we put the amount of the invoice in the default currency, which we will call Price. We can also find it in the Bookkeeping table as PriceTotalExcludingVatDefaultCurrency. Finally, from the Drop Down Menu Values, drag the En item to the Filters section. Thanks to this, we will be able to filter only invoices issued in the table.
Changing the view of a report
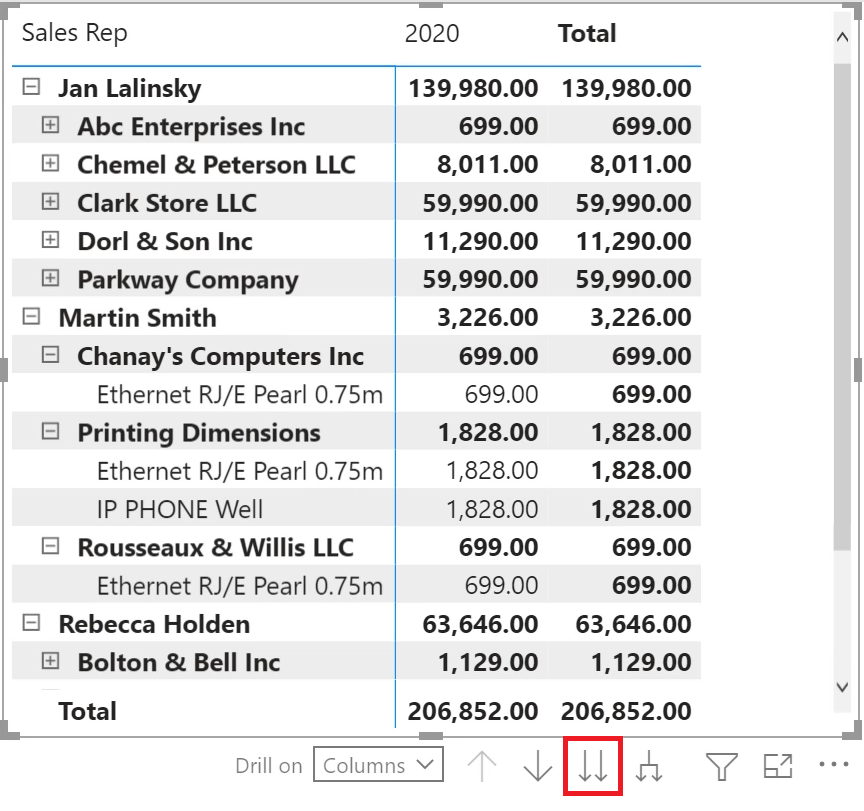
As soon as we finish creating the report, the current data will appear in the table. Order of the Rows we inserted into the table is crucial as it determines the hierarchy of data. By scrolling, we can easily change the order.
We now have sales broken down by sales reps. When we open the line with the sales rep, we will see the sales divided among individual clients. And when we open a client line, sales for that client are split according to specific products.
The option where we move Companies in the hierarchy of rows above Products and move sales reps to third place will probably be used more often by supplier companies that are more interested in Customer Lifetime Value than in the current performance of sales reps. On the contrary, products in the first place can be interesting for a company that is currently updating its offer. Why produce or order goods that do not have sales?
Probably the decline in sales is only a seasonal matter. Maybe it would be worth looking at sales from another perspective. After all, that is why we put in the Columns the date when the invoice is issued. When you click on the button with two down arrows in the table, the view changes to the time distribution of sales - years, months, quarters or even days.
Automatic updating
Once we are happy with the report, we will Publish it on the Home tab. Thanks to this, we can access the report from the web and from a smartphone. Then all we have to do is to set up automatic updates.
The area where Power BI is beating Excel is the freshness of the data in the reports. Once you set up updates in Power BI at regular time periods the reports will always be based on current data in eWay-CRM.
We can easily set up data synchronization from eWay-CRM in PowerBI.com. After signing in, you will find the Workspaces in the menu, where the report you just created is located. Just move your mouse over the dataset and click on Schedule refresh. Then just expand the Scheduled refresh section and set the update frequency as needed.
From now on, you will have an interactive, responsive and, most importantly, always up-to-date report for every year.
You can start with Power BI dashboards even if you don’t know the software
From the moment you finish creating and setting up an update, you will have an interactive, responsive, and most importantly up-to-date report for every year. No data rewriting. Just creating new beautiful reports. And, as you've probably noticed, it's not complicated. It just takes a little practice.
But there is also a second way to connect eWay-CRM with Power BI and analyze company data immediately - without having to learn to work with Power BI. And that is the eWay-CRM Sales Executive Dashboard. As the name suggests, this is a ready-made Dashboard with many useful reports for entrepreneurs, sales directors and anyone who needs to analyze business data. After installation and quick setup, you can start using the application immediately.