From UA to GA4, Part 4: Create Your Google Analytics 4 Reports with Ease

In this article series, I am exploring the transition from Universal Analytics (UA) to Google Analytics 4 (GA4).

Welcome back to the fourth and final part of our comprehensive Google Analytics blog series.
Teaming up with data analyst Zdenek Hejl, we aim to provide you with the know-how and hands-on guidance to make the most of Google Analytics 4 (GA4).
In the previous parts of this series, we explored the fundamentals and key differences between Universal Analytics (UA) and GA 4, provided a step-by-step transition guide, and took a deep dive into GA4's user interface and default reports.
It's time to level up
Learn how to create and customize your reports using GA4's powerful features!
In this final part, we'll explore segments, dimensions, and metrics, and then walk you through the process of creating a custom report using our own Google Analytics 4 property.
Content:
1. Segments, Dimensions, and Metrics: The Building Blocks of GA4 Reports
Before we dive into creating a custom report, let's take a moment to understand the fundamental components of GA4 reports.
Segments
Segments are subsets of your data that allow you to analyze specific user groups or behaviors. In GA4, you can create segments based on various criteria such as demographics, device type, or user behavior (e.g., visitors who completed a purchase). By using segments, you can gain deeper insights into the performance of specific user groups and make more informed decisions for your marketing campaigns.
Dimensions
Dimensions are attributes that describe your data, such as page title, event name, or source/medium. They provide context to your metrics and allow you to analyze your data from different perspectives. In GA4, you can use dimensions to group, filter, or break down your data in various ways to gain insights into specific aspects of your website or app performance.
Metrics
Metrics are quantitative measurements that represent the performance of your website or app, such as sessions, users, or revenue. In GA4, you can use metrics to evaluate your marketing campaigns, track your progress toward your goals, and identify areas for improvement or optimization.
2. Crafting Your Custom GA4 Report Using Explore Feature
Now that we've covered the basics, let's create a custom report using our own Google Analytics 4 property.
One of the most powerful features of GA4 is the Explore tool. It allows you to create custom reports and visualizations using your data and dimensions.
To access Explorations, you need to have a GA4 property set up for your website or app. If you don't have one yet, you can follow this guide to create one.
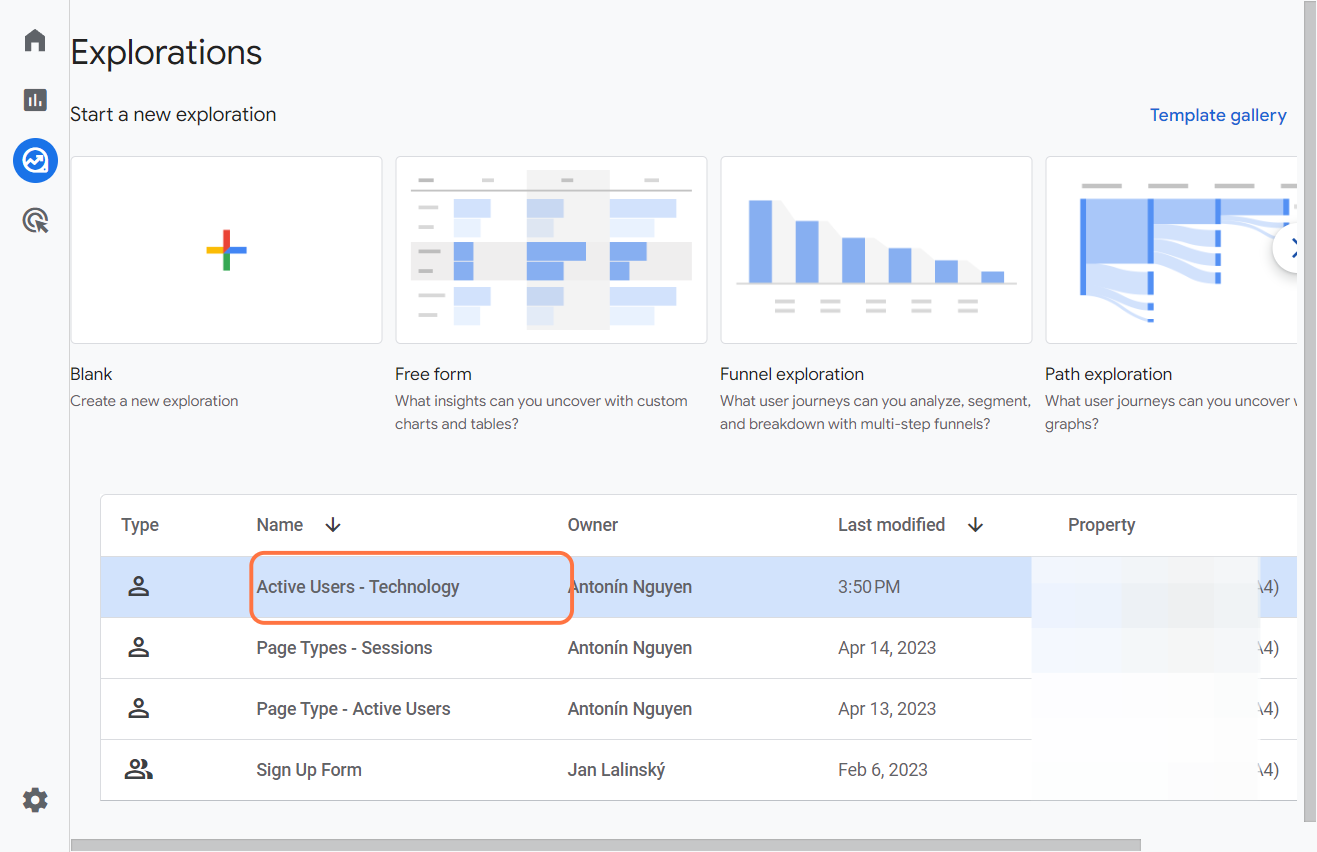
Once you have a GA4 property, you can find the Explore tool in the main navigation menu on the left.
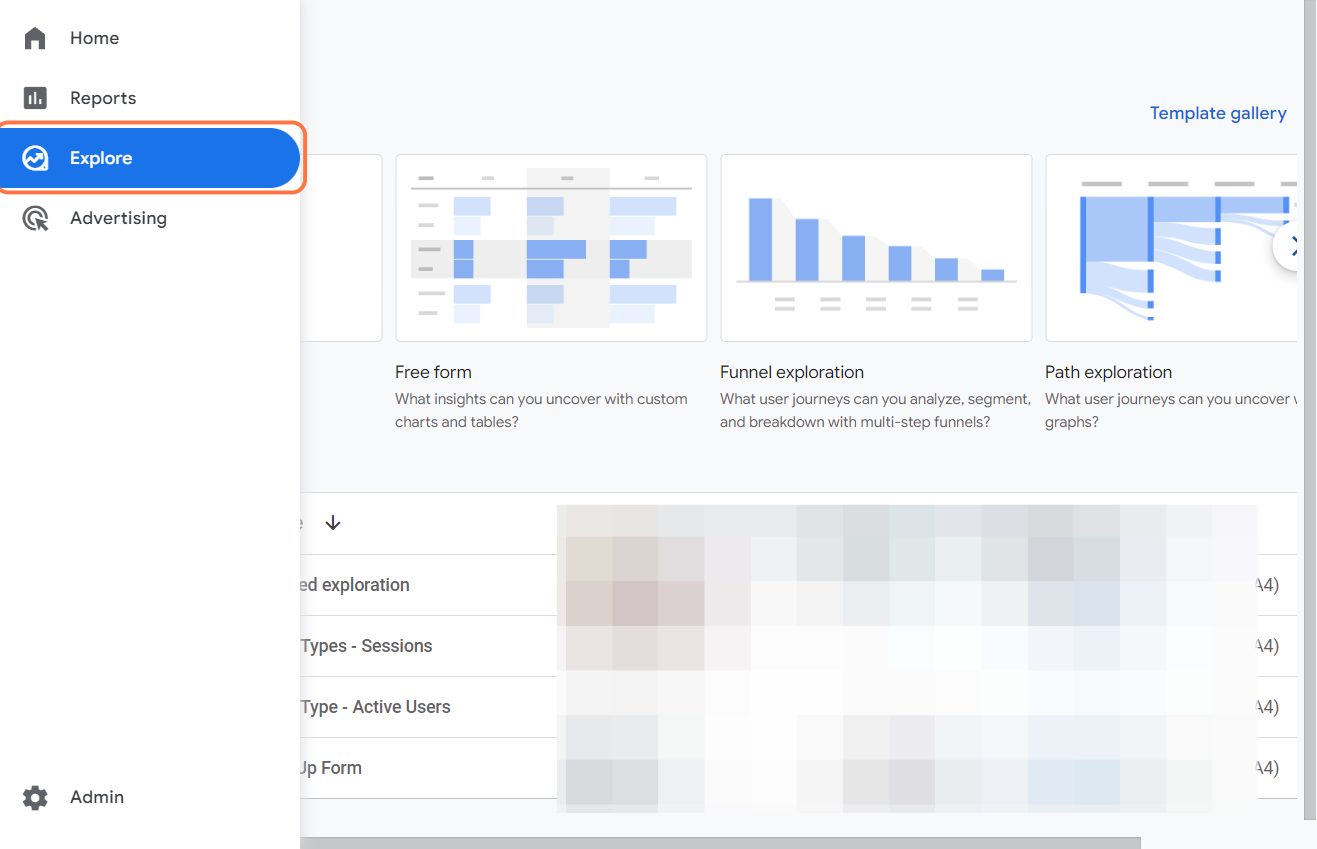
You can choose from different templates in the gallery, such as funnel analysis, path analysis, segment overlap, or cohort analysis,
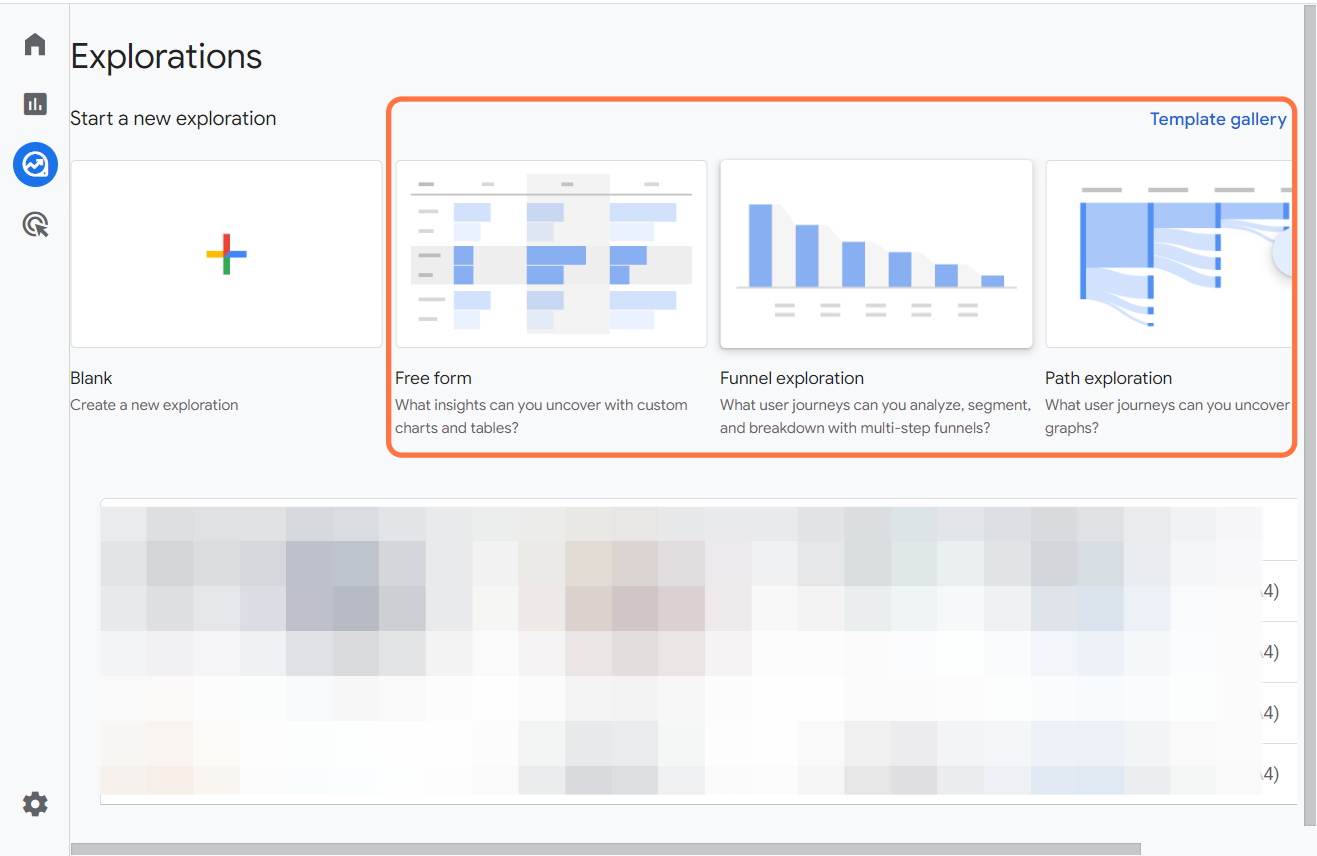
or start from scratch and build your own report using various charts and tables.
You can apply filters, segments, and comparisons to drill down into the details and uncover insights.
Explorations can help you understand:
- how users interact with your website or app,
- what actions do they take,
- what outcomes do they achieve,
- and how they differ by various attributes.
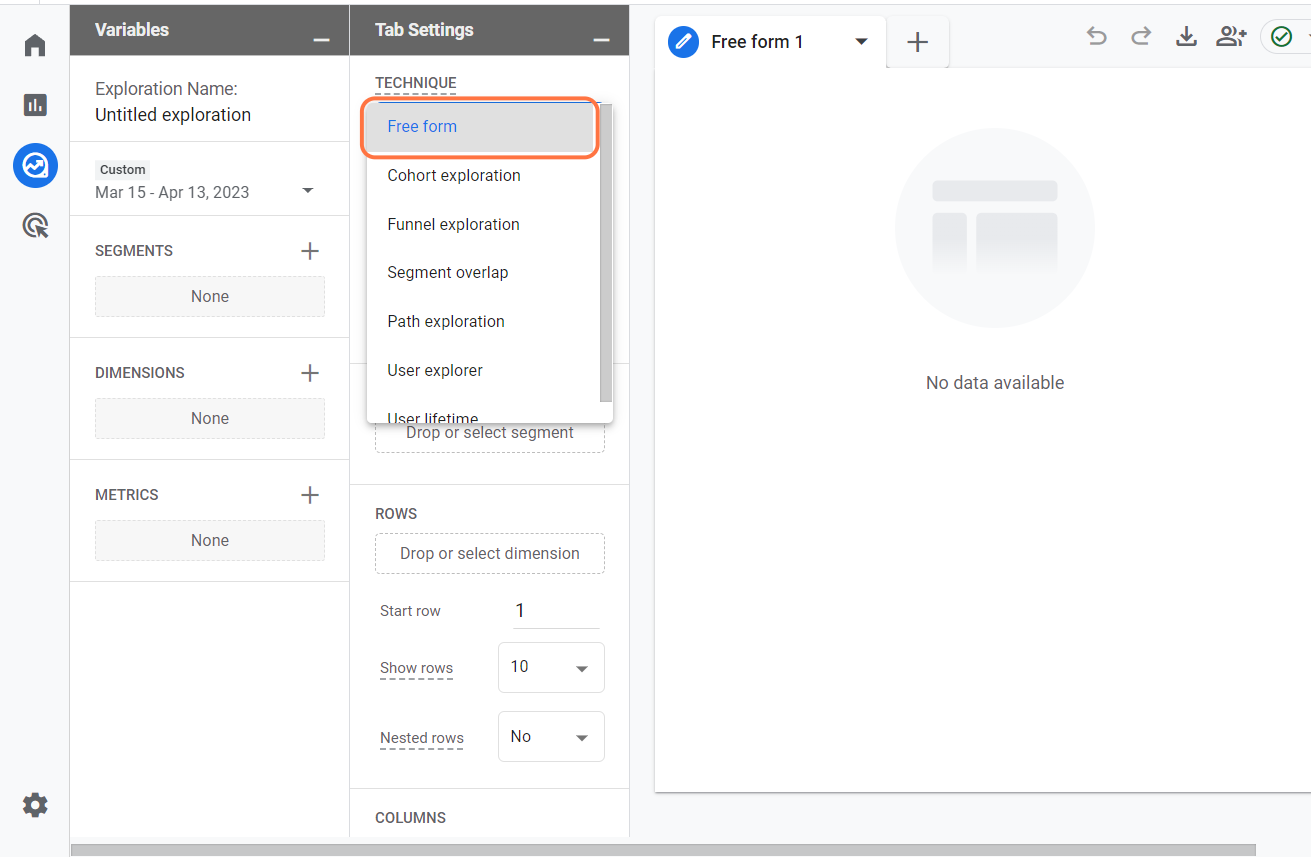
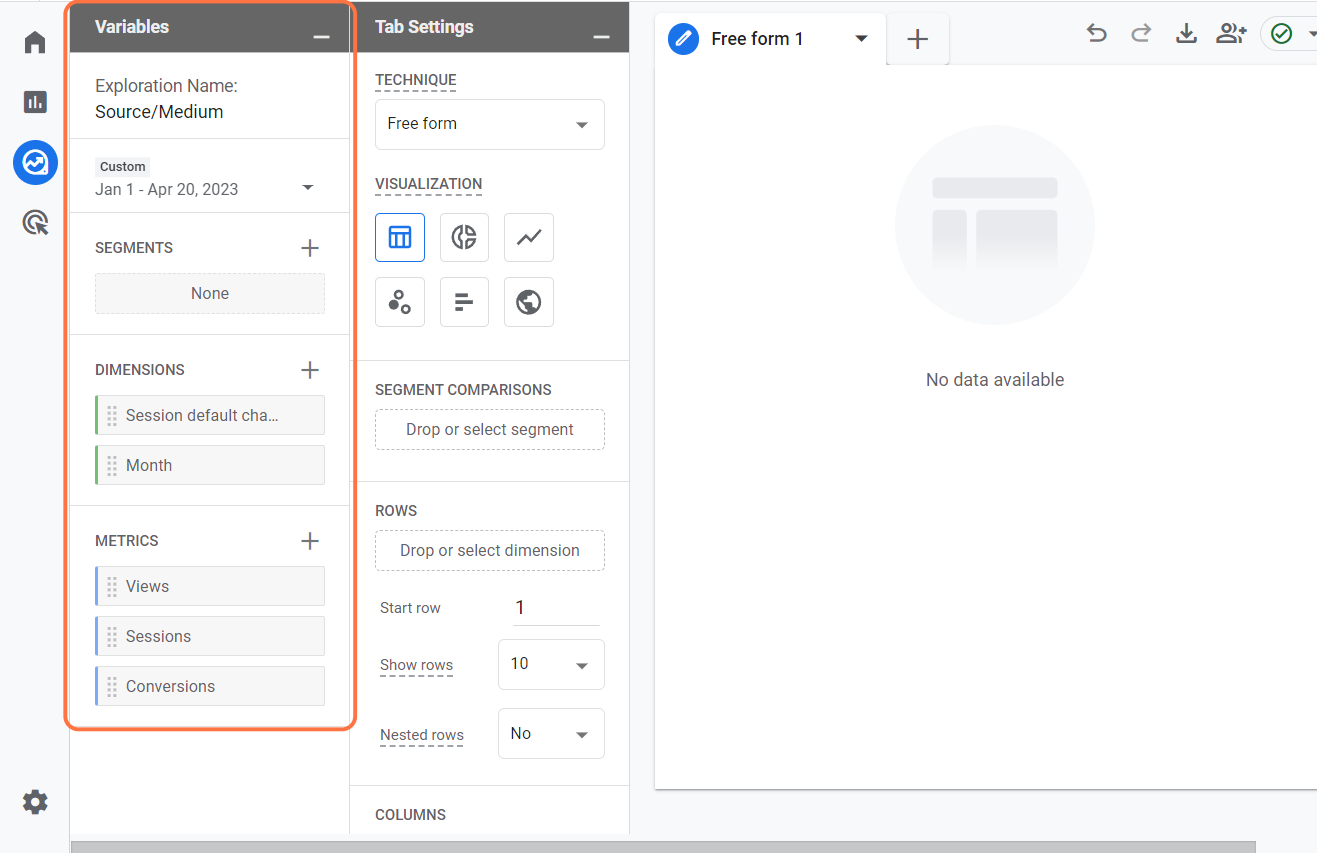
Create your report in Google Analytics 4
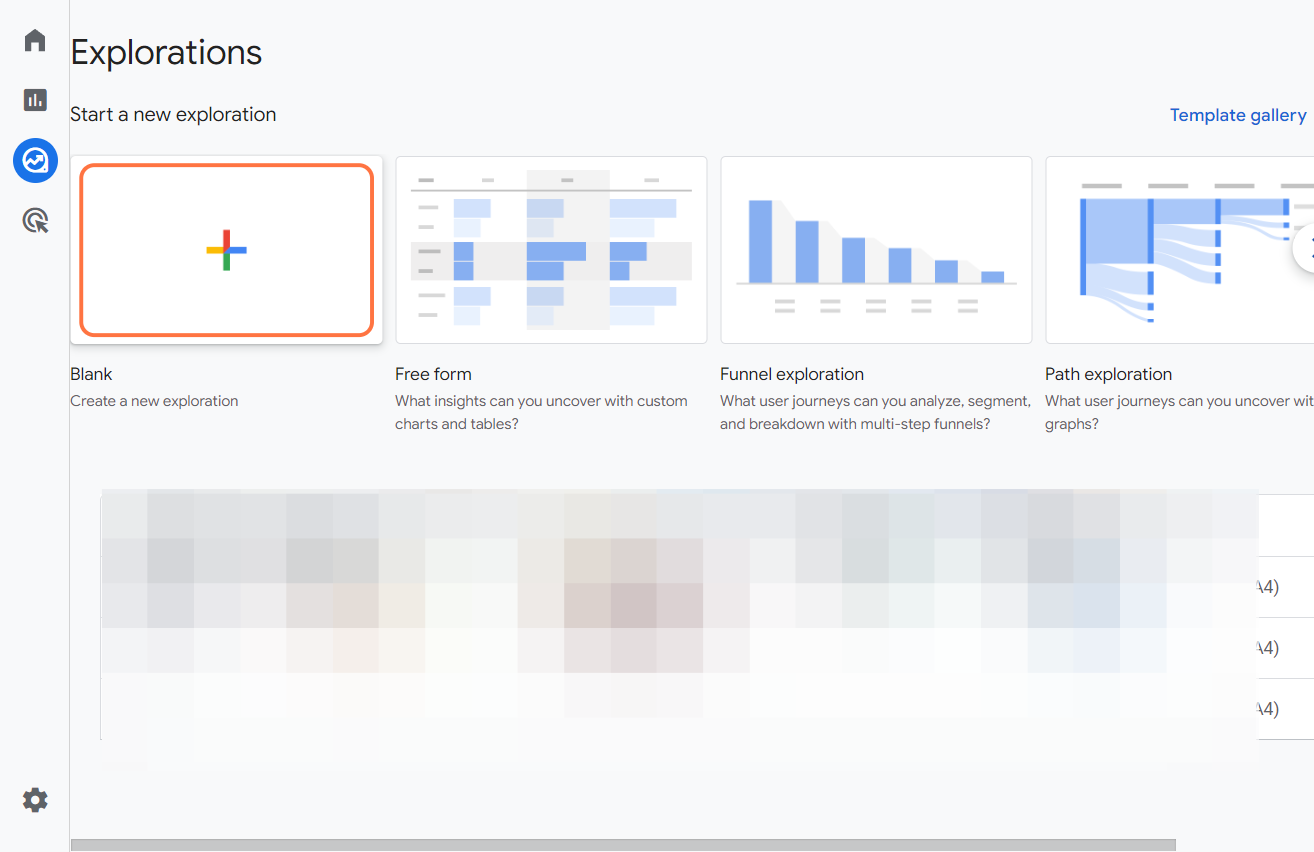
- Choose analysis technique.
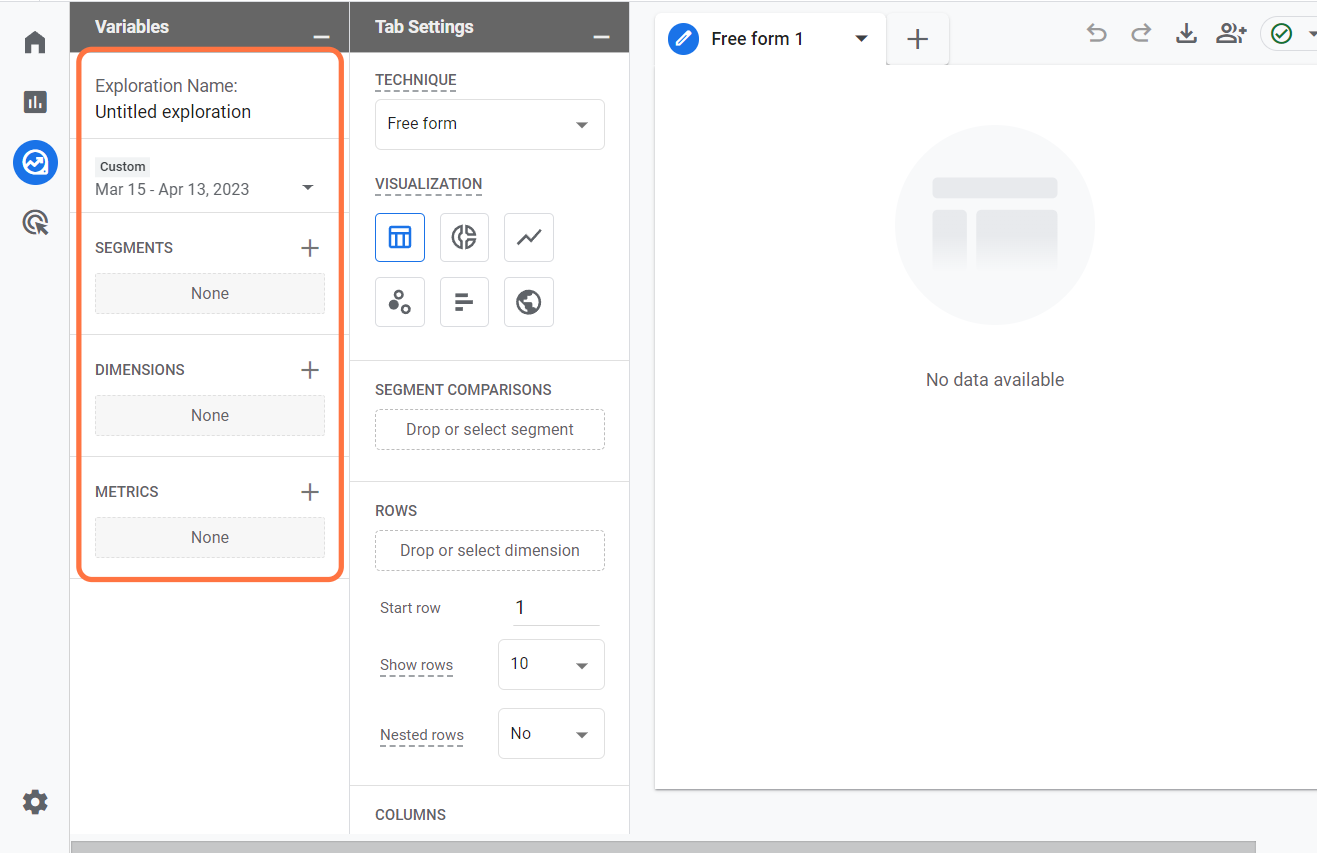
- Configure your report settings. Name your report, set period, and add segments, dimensions, and metrics.
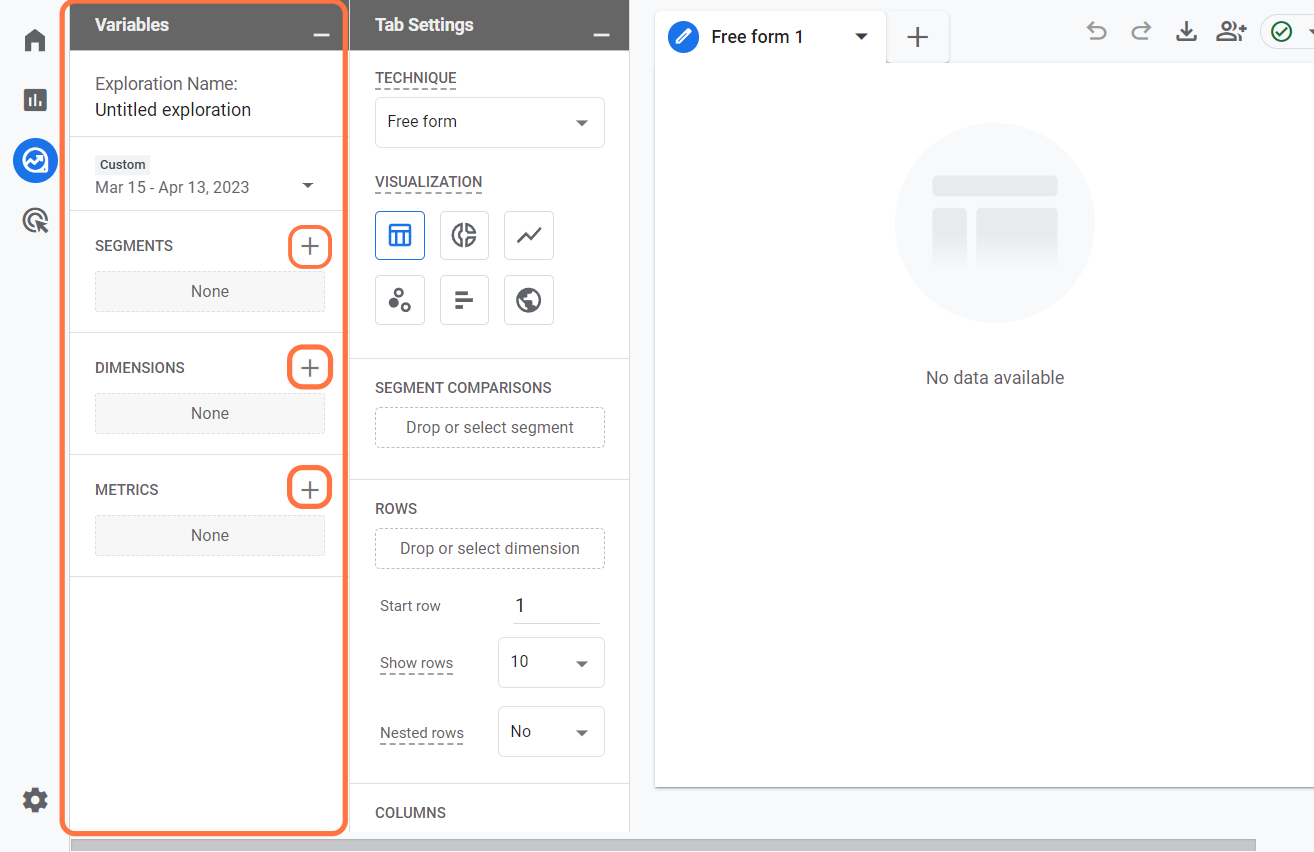
- Drag each component to the corresponding blocks.
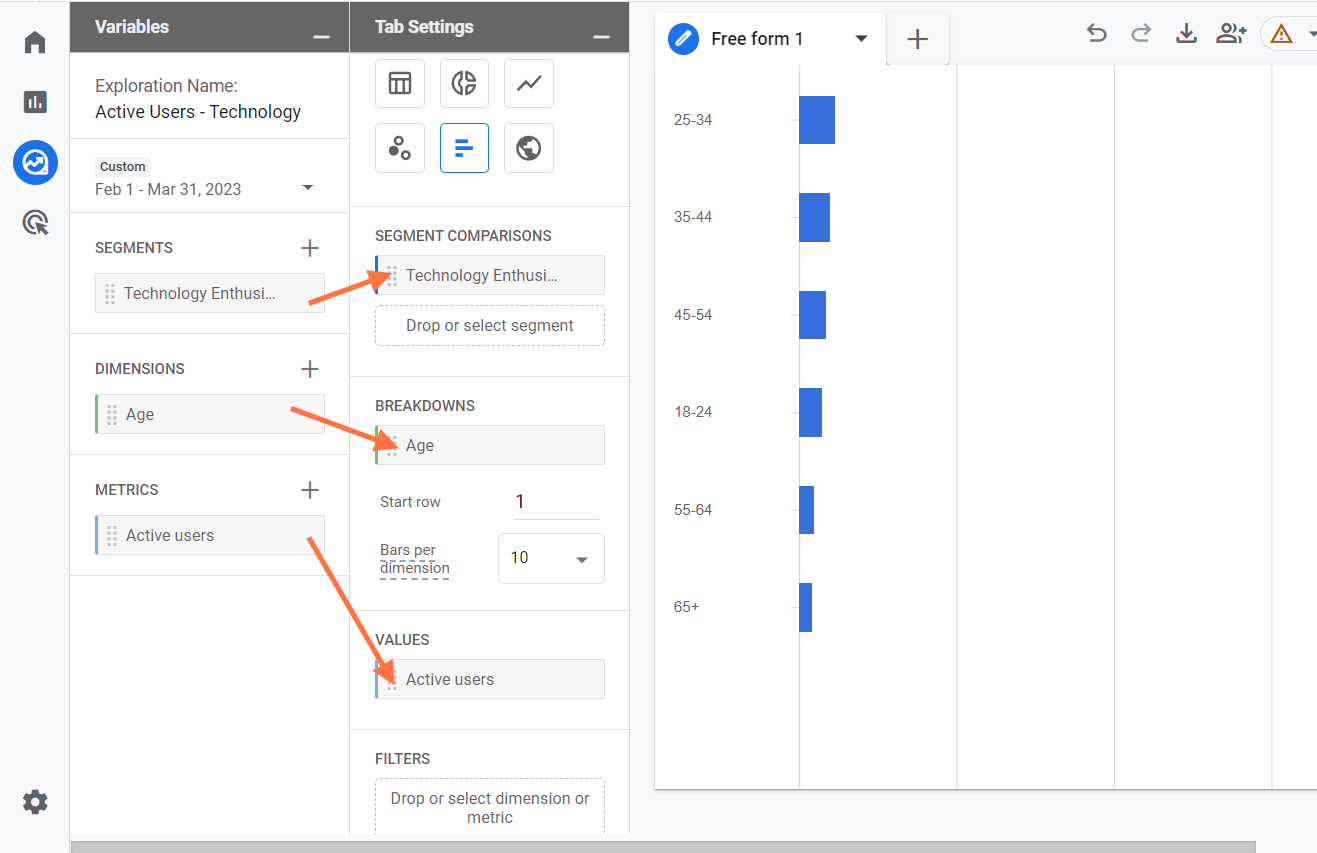
- Customize your report layout and visualization options.
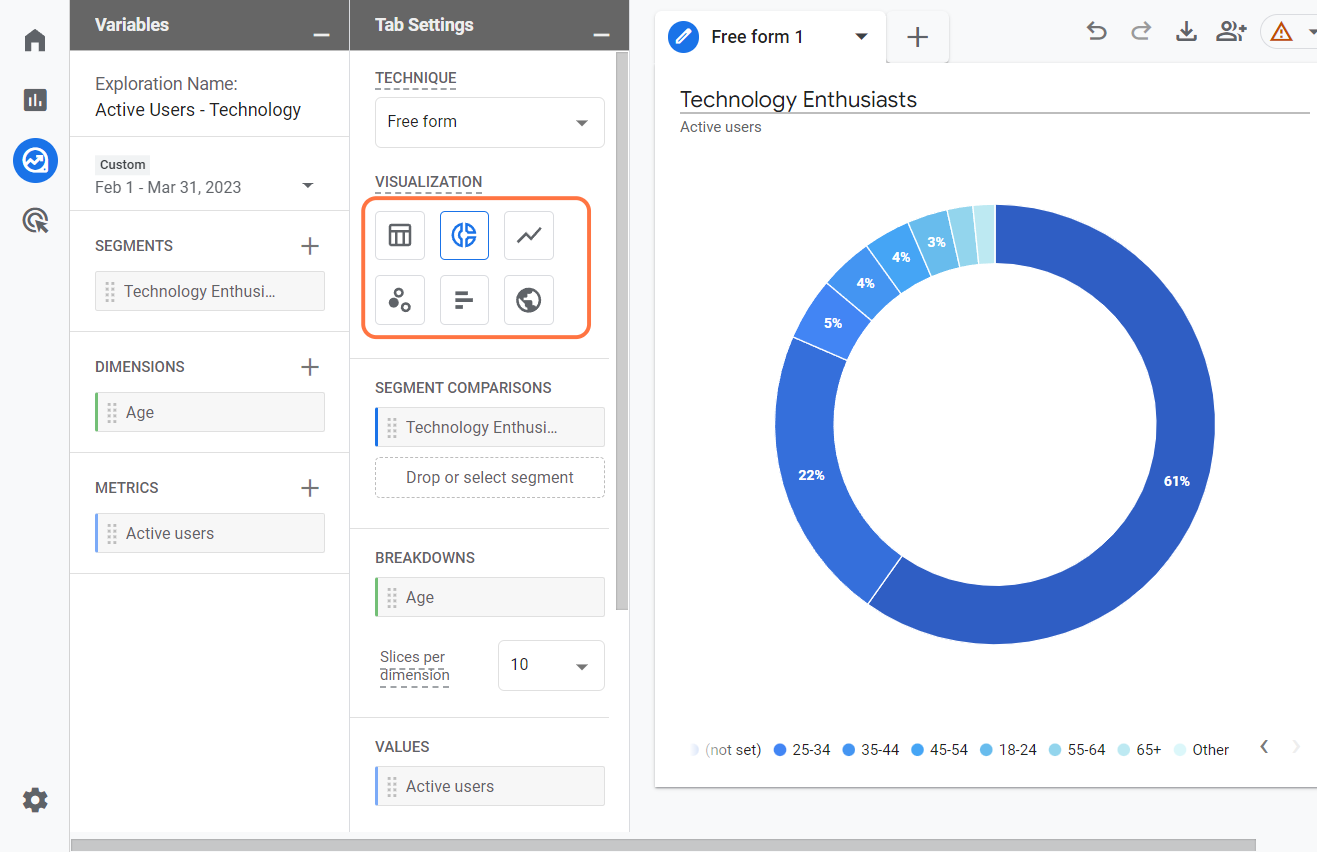
- Completed! There's no save button. Locate your report on the Explorations page.
Different types of GA 4 Reports
Creating tailored reports in Google Analytics 4 is key to understanding your website's performance and boosting its success. Now, I will create two of the many reports I'll review monthly. I encourage you to explore various report types in Google Analytics 4. Customize them to your objectives for optimal results.
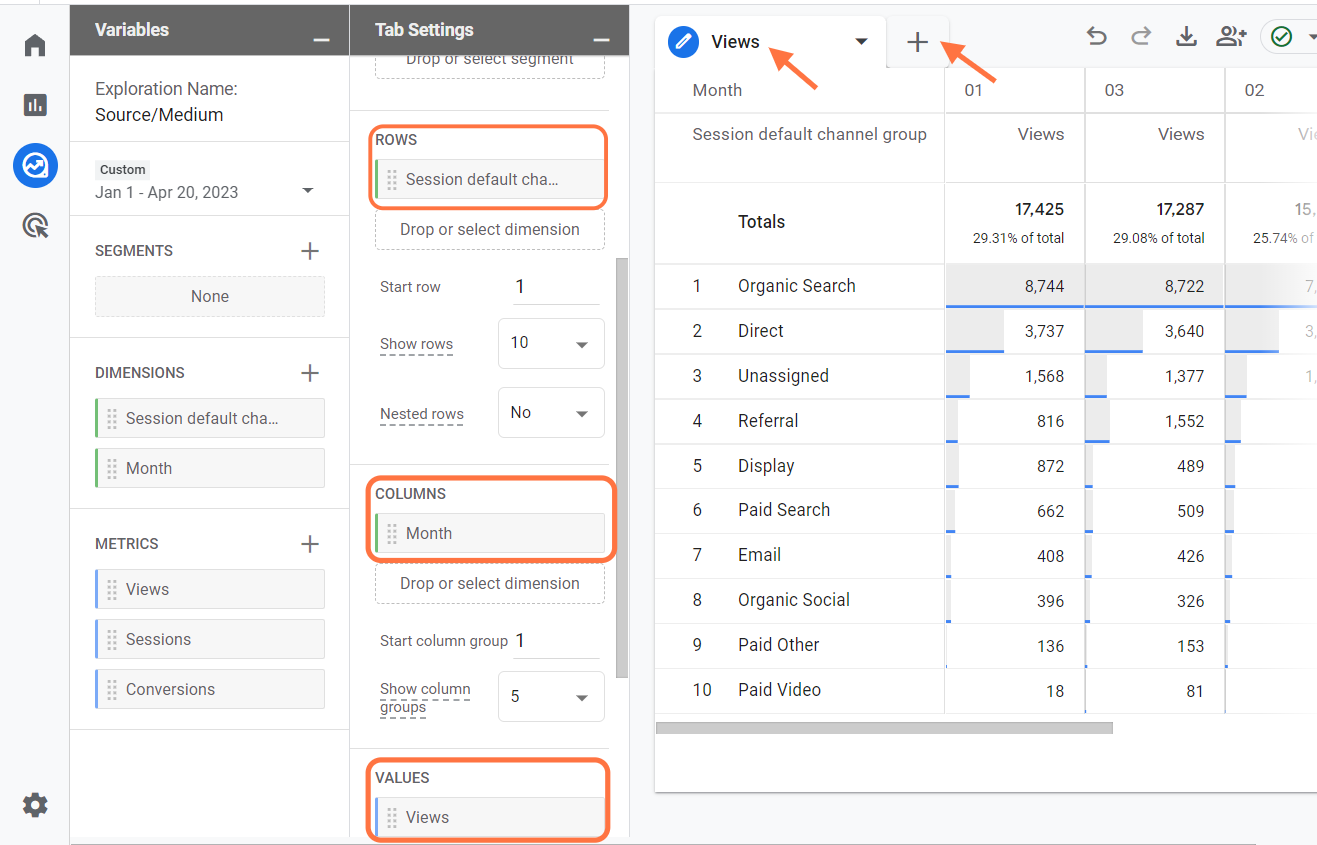
Source/Medium Report
The Source/Medium report reveals the sources that bring visitors to your website. Use this information to decide where to invest your time and money for the best results.
Name your report and set the period you want to review. Then select the building blocks of this specific report as follows:
Note: Full name of the first dimension is Session default channel group
Drag and drop components to the corresponding blocks. To better navigate through these reports, create a new form for each metric we have defined (Views, Sessions, Conversions).
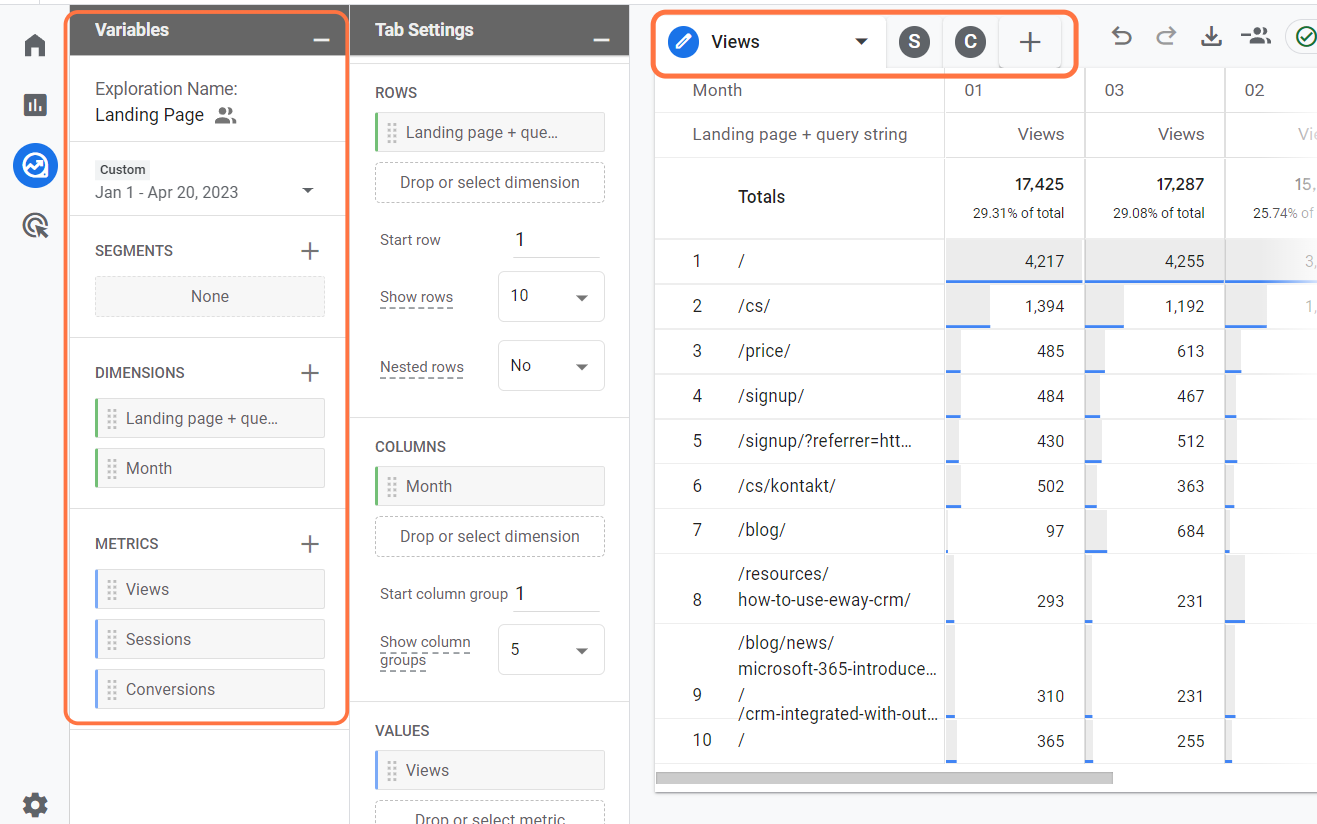
Landing Page Report
A landing page is the first page that a user sees when they visit your website. Optimize your landing pages for conversions, as it can influence the user's decision to stay on your website or leave. Knowing how different landing pages perform enables you to make smart changes that keep users engaged and interested.
Select the building blocks for this specific report. Again, make sure to create a new form for each metric to navigate yourself better.
Final Words
Congratulations! You've reached the end of our GA 4 blog series. By now, you should have a solid understanding of the fundamentals, how to migrate from Universal Analytics to GA 4, and how to navigate the GA 4 user interface and create your custom reports. With this knowledge in hand, you're well-equipped to optimize your marketing strategies based on data-driven insights.
Remember, the key to success in digital marketing lies in continuously learning, experimenting, and adapting your strategies based on the insights you gather from your data. Google Analytics 4 is a powerful tool that can help you achieve your marketing goals by providing you with valuable insights and actionable recommendations.
Thank you for following this series, and I wish you the best of luck in your data adventures!