From UA to GA4, Part 3: Exploring Google Analytics 4 Interface and Reports

In this article series, I am exploring the transition from Universal Analytics (UA) to Google Analytics 4 (GA4).

Welcome back to our blog series, which aims to ease your transition from Universal Analytics (UA) to Google Analytics 4 (GA4).
I am thrilled to guide you through this journey alongside the capable data analyst, Zdenek Hejl.
In the previous two installments, we delved into the basics, notable distinctions between UA and GA4, and the stepwise approach to migration.
Update: Part 4 is out as well!
Now, let's dive into Part 3!
Content
1. Navigate Google Analytics 4 UI
Understanding the GA4 User Interface
To truly benefit from GA4, we need to get to know its user interface. Once we understand how it works, we can find data fast and make important decisions.
Let’s start!
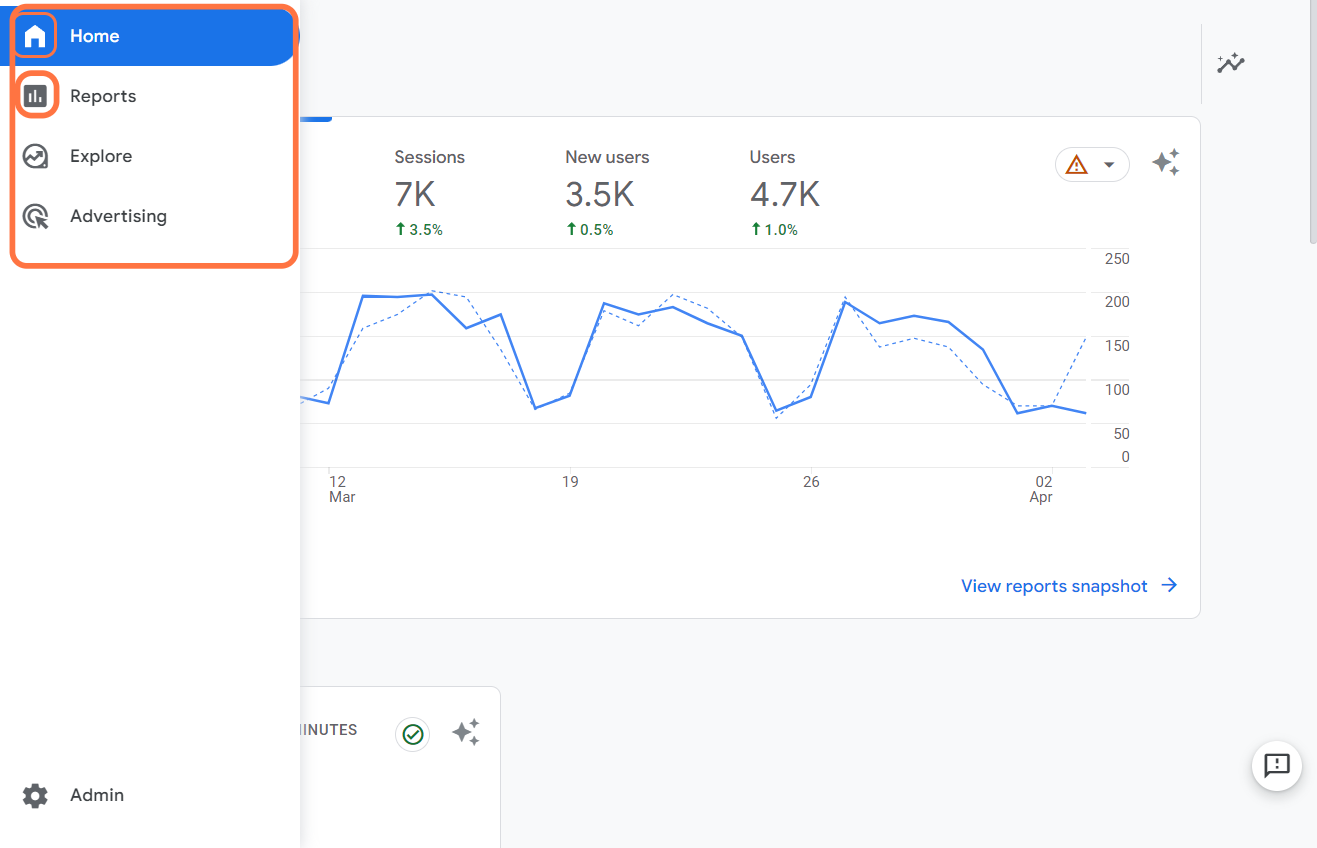
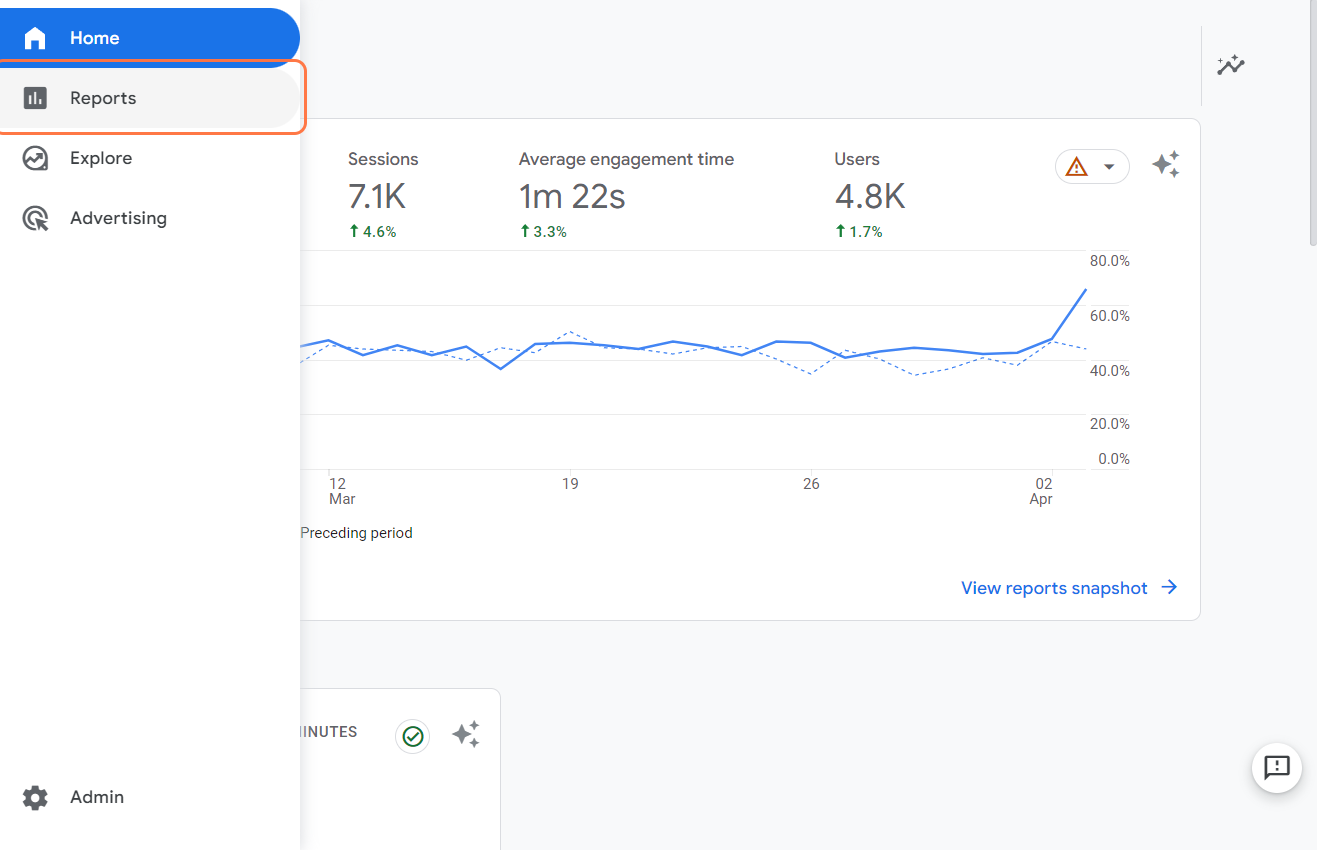
Main Navigation
Located on the left side, the main navigation offers access to essential features. Here, you'll find Home, Reports, Explore, and Advertising tabs.
Note: In this article, we will take a closer look at the Home and Reports sections.
Home Tab
The Home tab in GA4's user interface is your one-stop shop for a quick overview of your website's performance. It provides a snapshot of essential metrics like the number of users, percentage change in users, sessions, and other key data points.
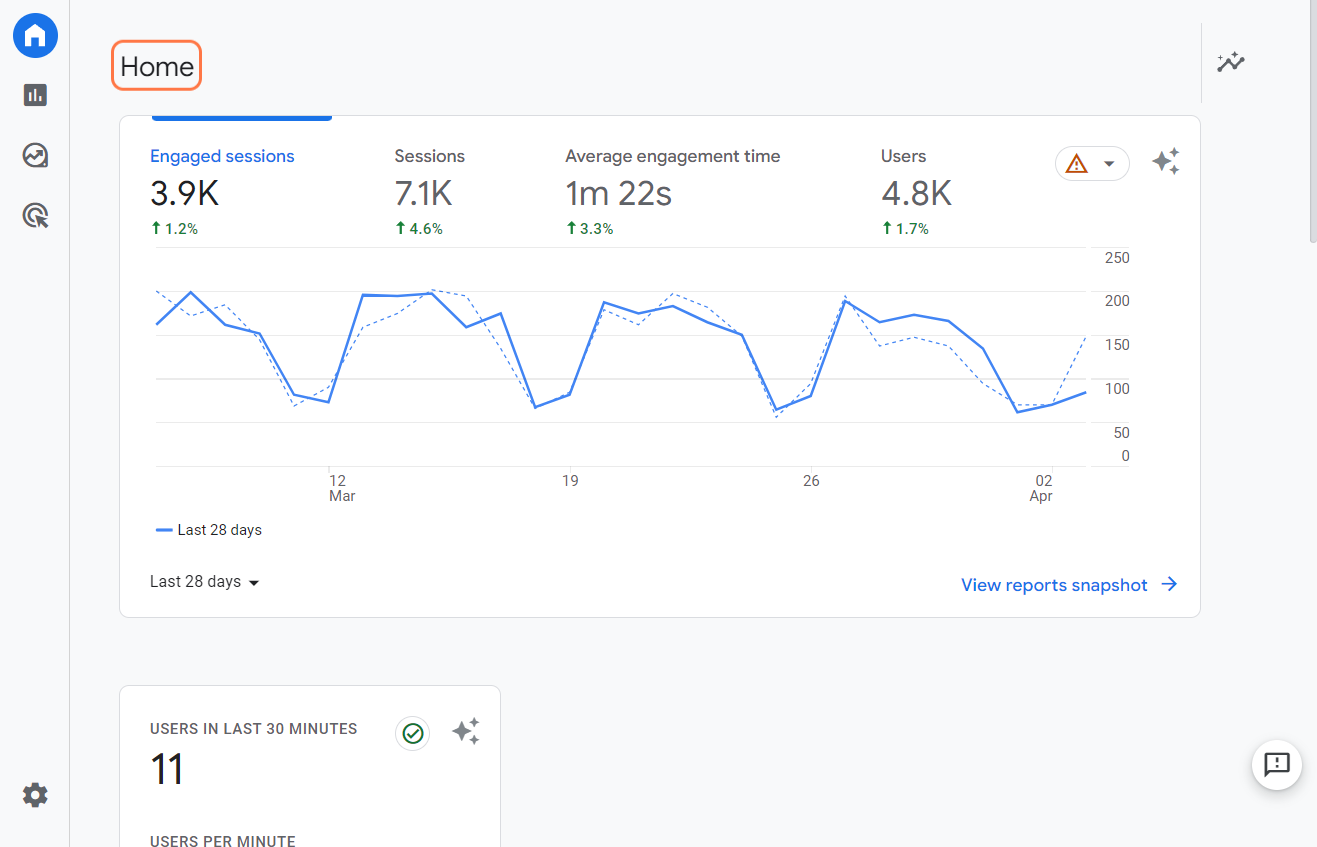
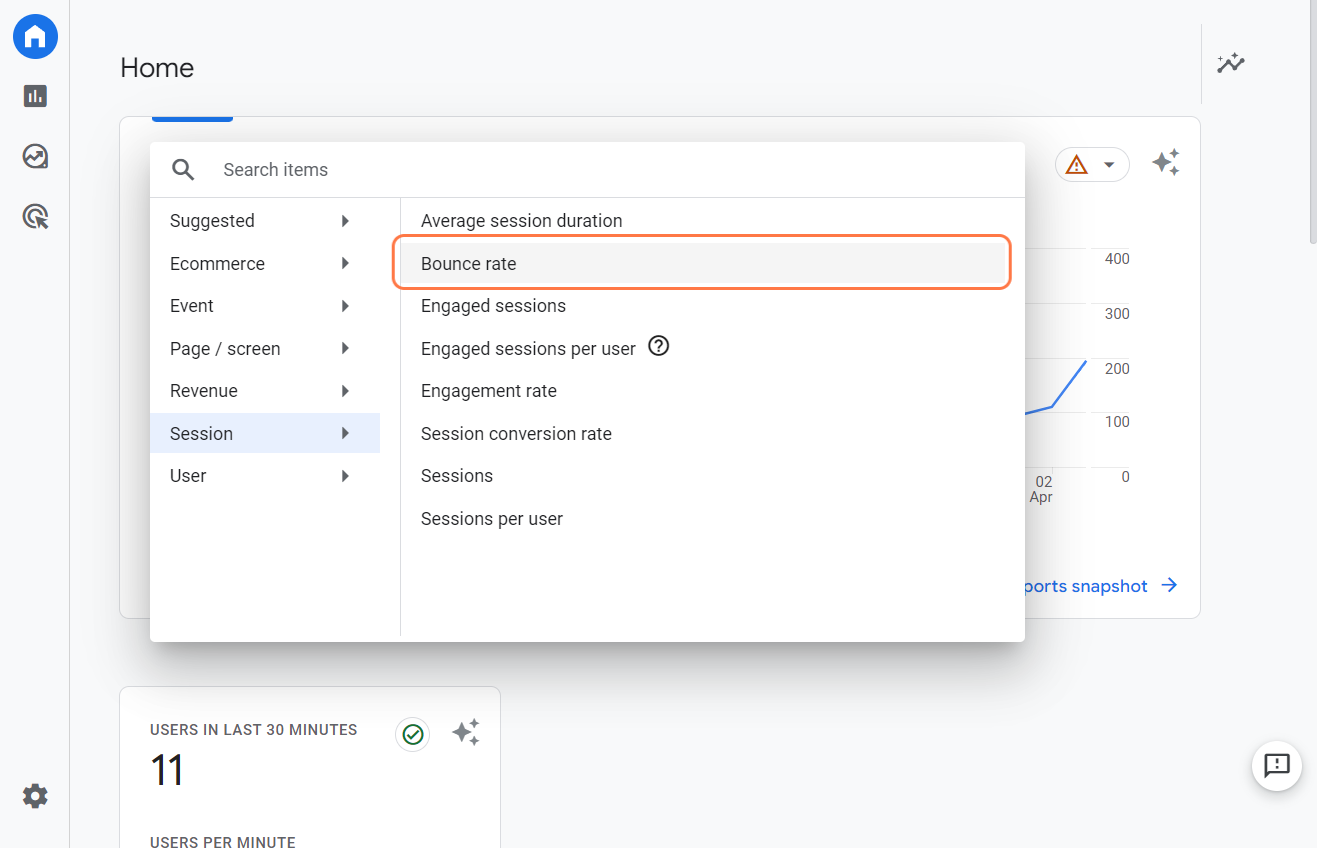
It also offers the handy feature of using filters. Yes, you can customize the displayed metrics to focus on the data most relevant to your business with a breeze.
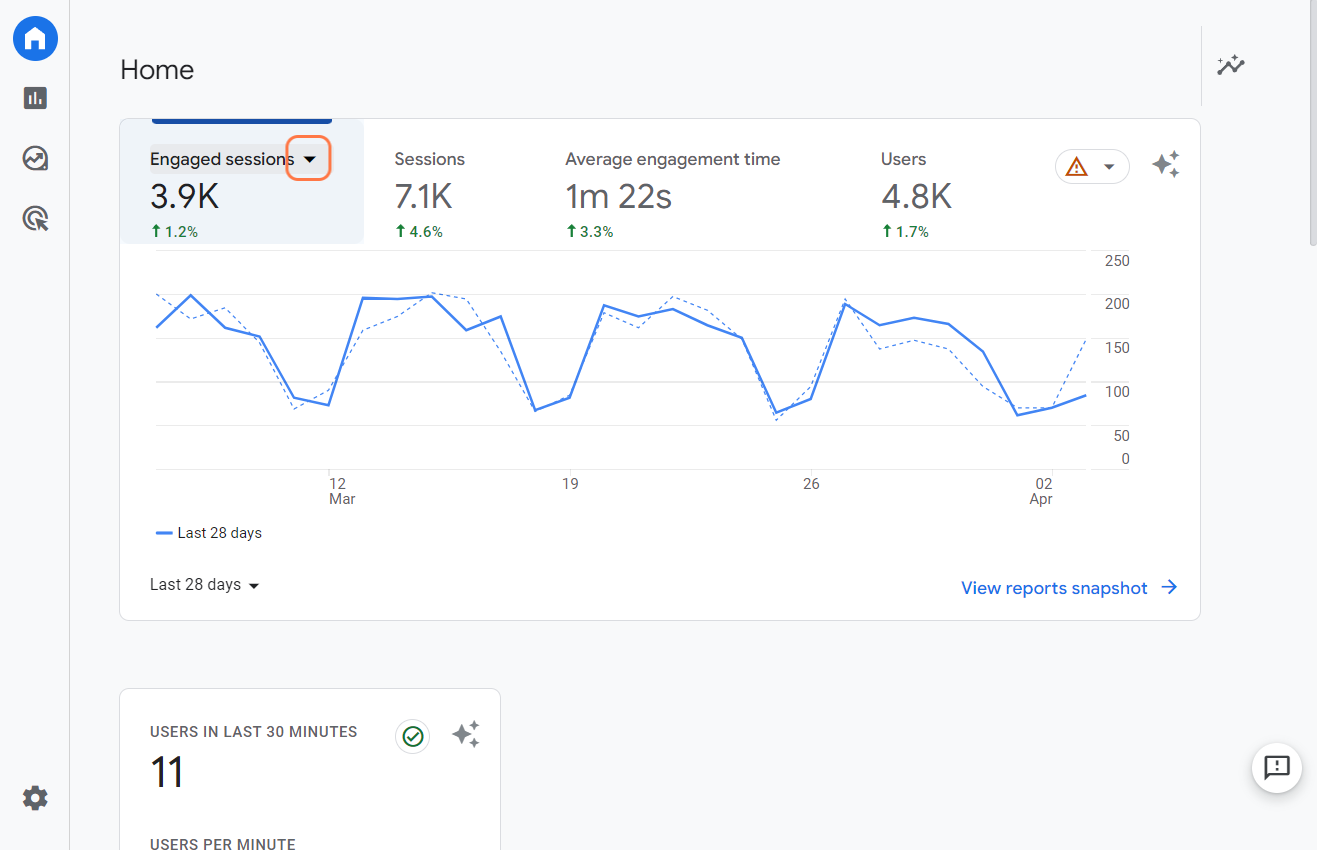
Choose from a variety of metrics to customize your “Home Page” easily.
Once you've selected the metrics you want to observe, you won't have to keep configuring them every time you log into your GA 4 account.
Search Bar
At the top of the interface, the search bar allows you to quickly find specific reports or settings.
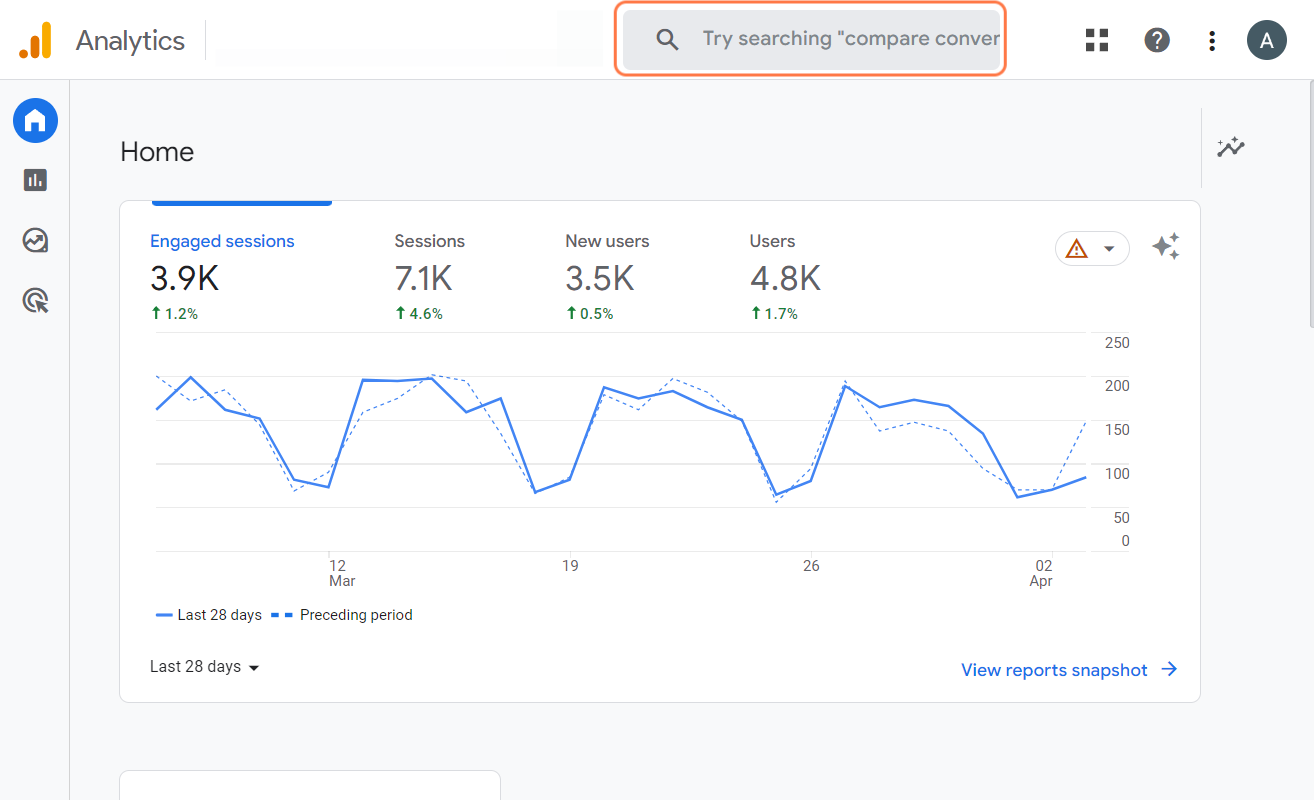
I find this feature insanely useful. It even whispers what reports you might be interested in! Simply type in “basic reports” or even ask a question.
Awesome, right?
One of the key features of GA 4 is the use of artificial intelligence (AI). AI in GA 4 can help you:
- Understand user behavior across different devices and platforms
- Identify trends and anomalies in your data
- Predict future outcomes and actions
2. Explore Default Reports
Exploring Reports in Google Analytics 4
Now that we have a good grasp of the GA4 user interface, it's time to dive into one of its key features: reports.
With GA4's advanced reporting capabilities, you will gain valuable insights into your audience and their interactions with your platform.
Let’s head over to Reports!
Reports Snapshot
Once you click on Reports in the GA4 menu, you'll land on the Reports Snapshot section. It's a bird's eye view of your website's performance.
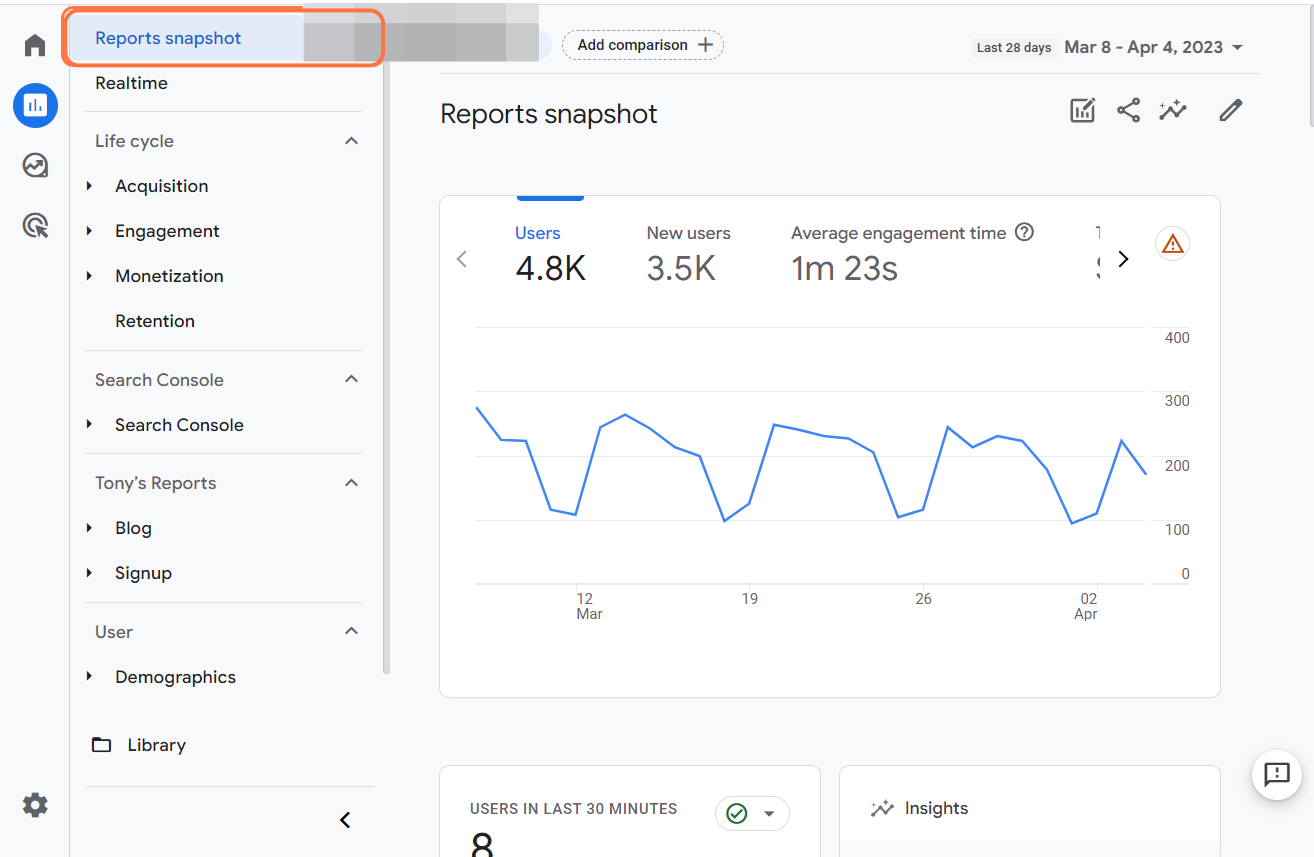
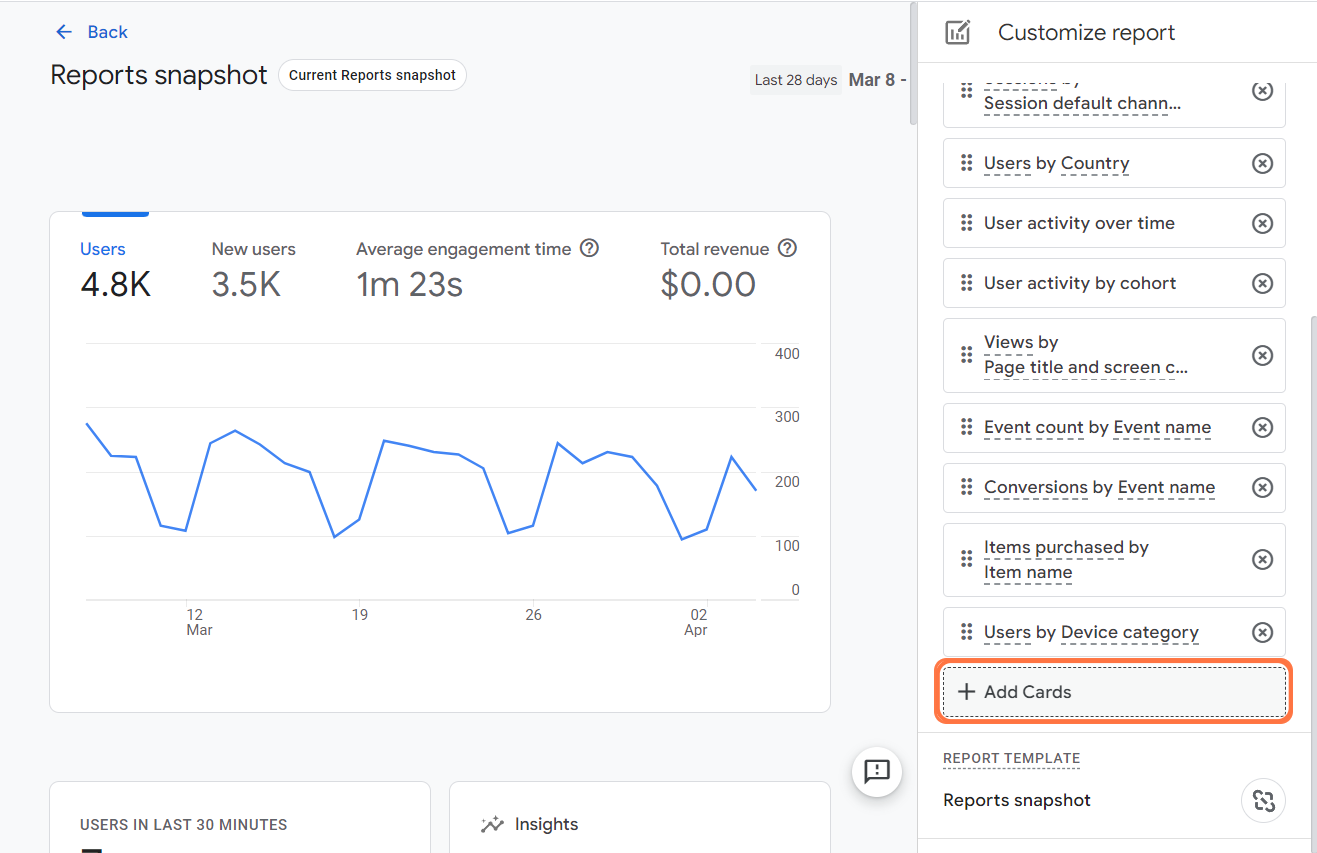
This section comes with pre-defined metrics, which are called "cards."
You can customize the report by setting any overview report as your Reports Snapshot and using the report builder. This feature is a fantastic way to get a quick glance at your website's overall performance without going too deep into the details.
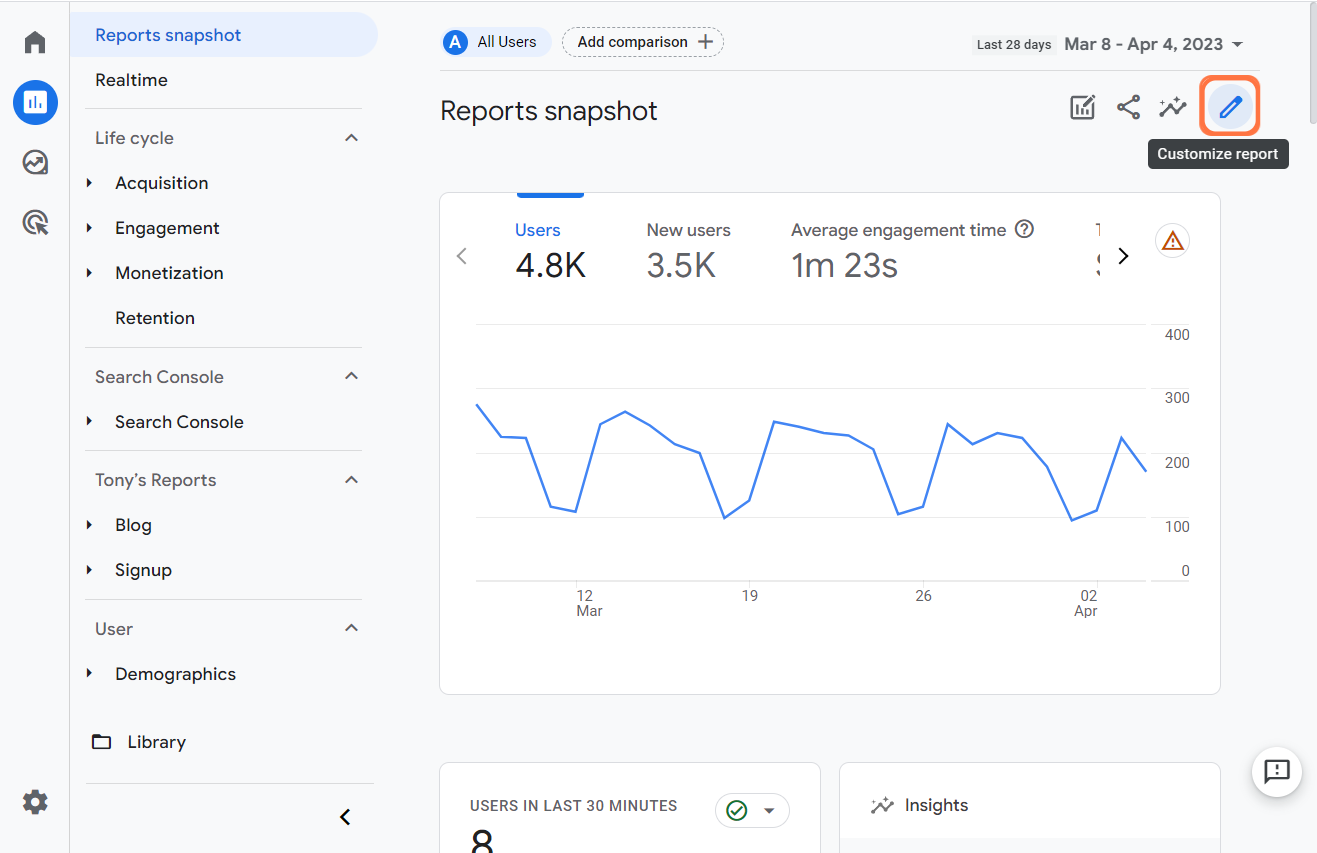
Here you can remove...
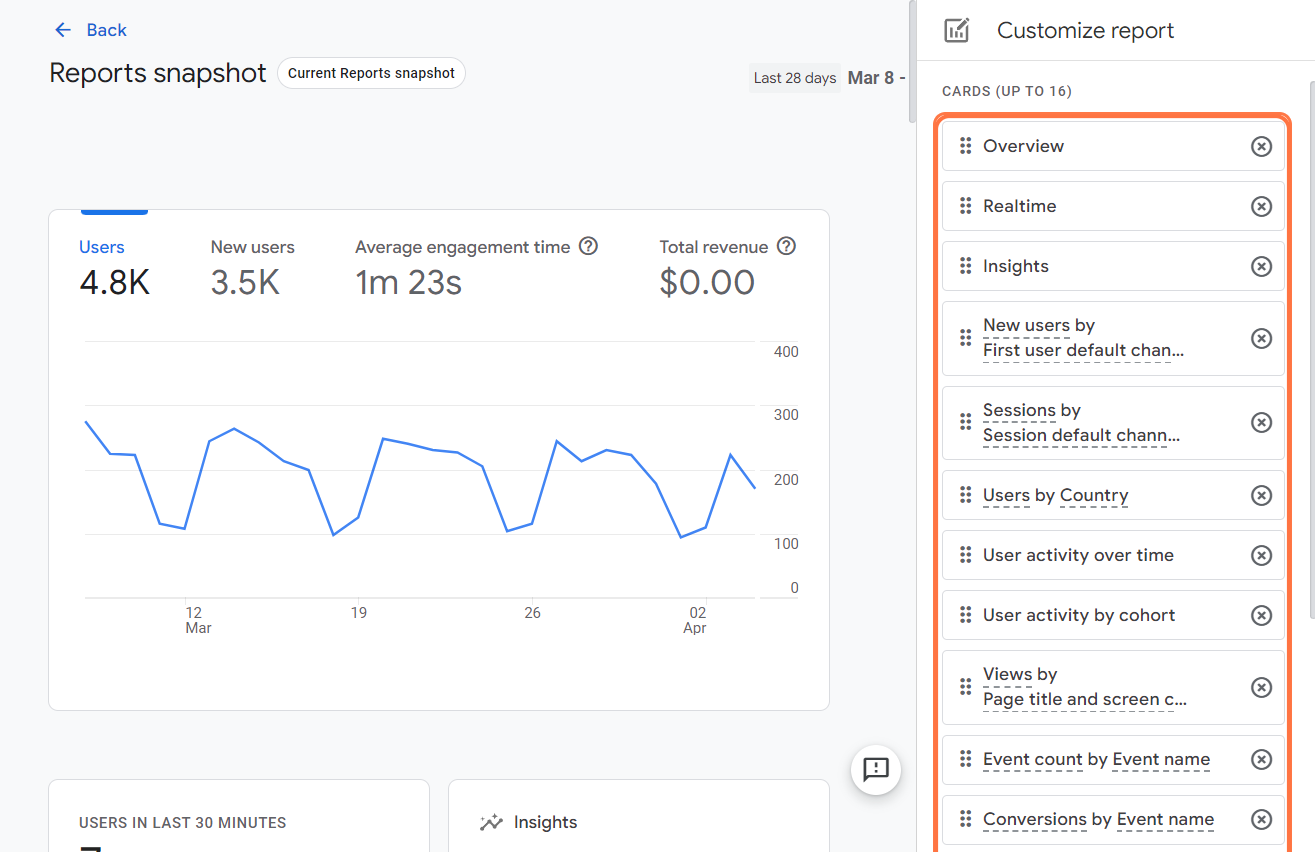
... or add cards you are interested in.
Compare different time periods in Google Analytics 4
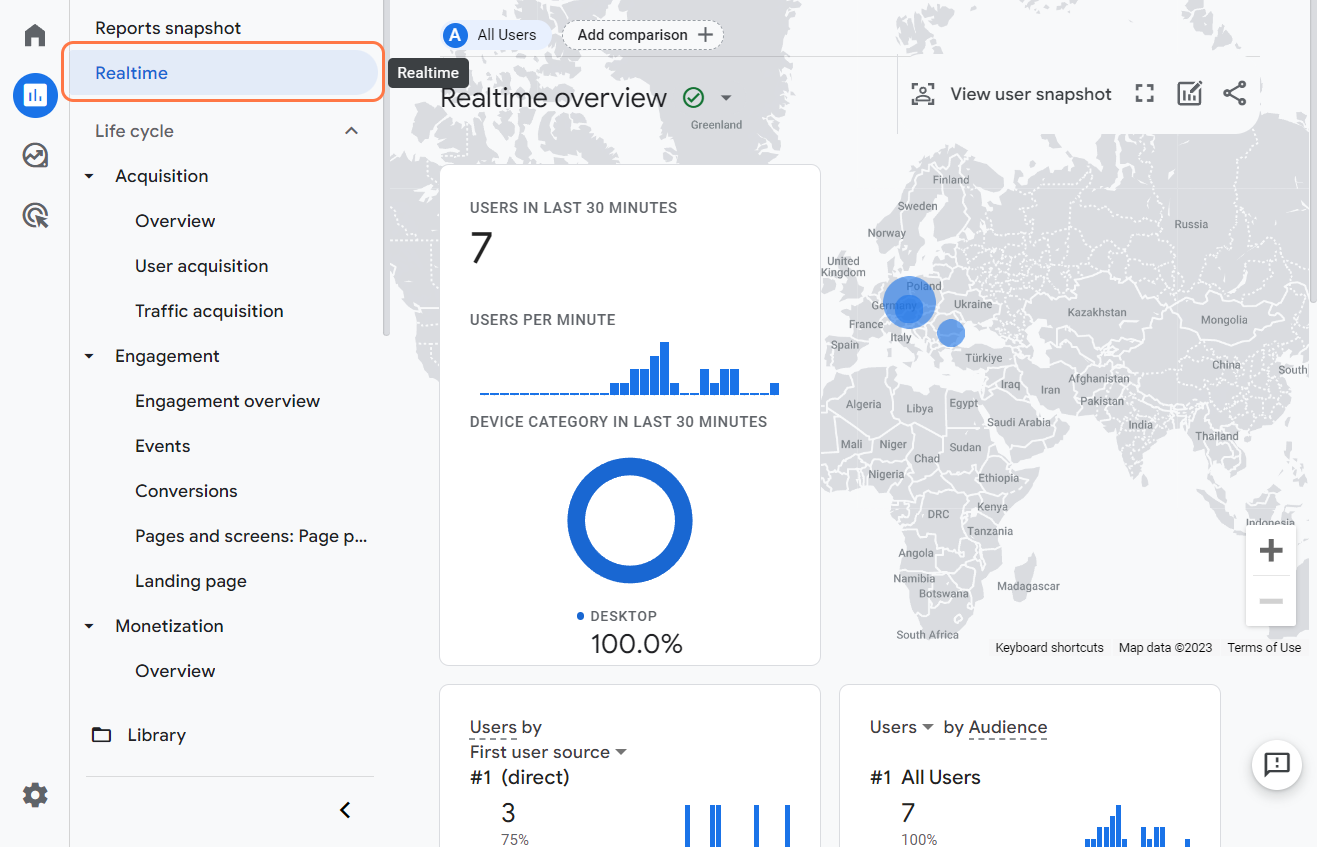
Realtime Report
If you want to see how your website is performing right now, you can use the Realtime report. This report shows you the number and behavior of users who visited your website in the last 30 minutes.
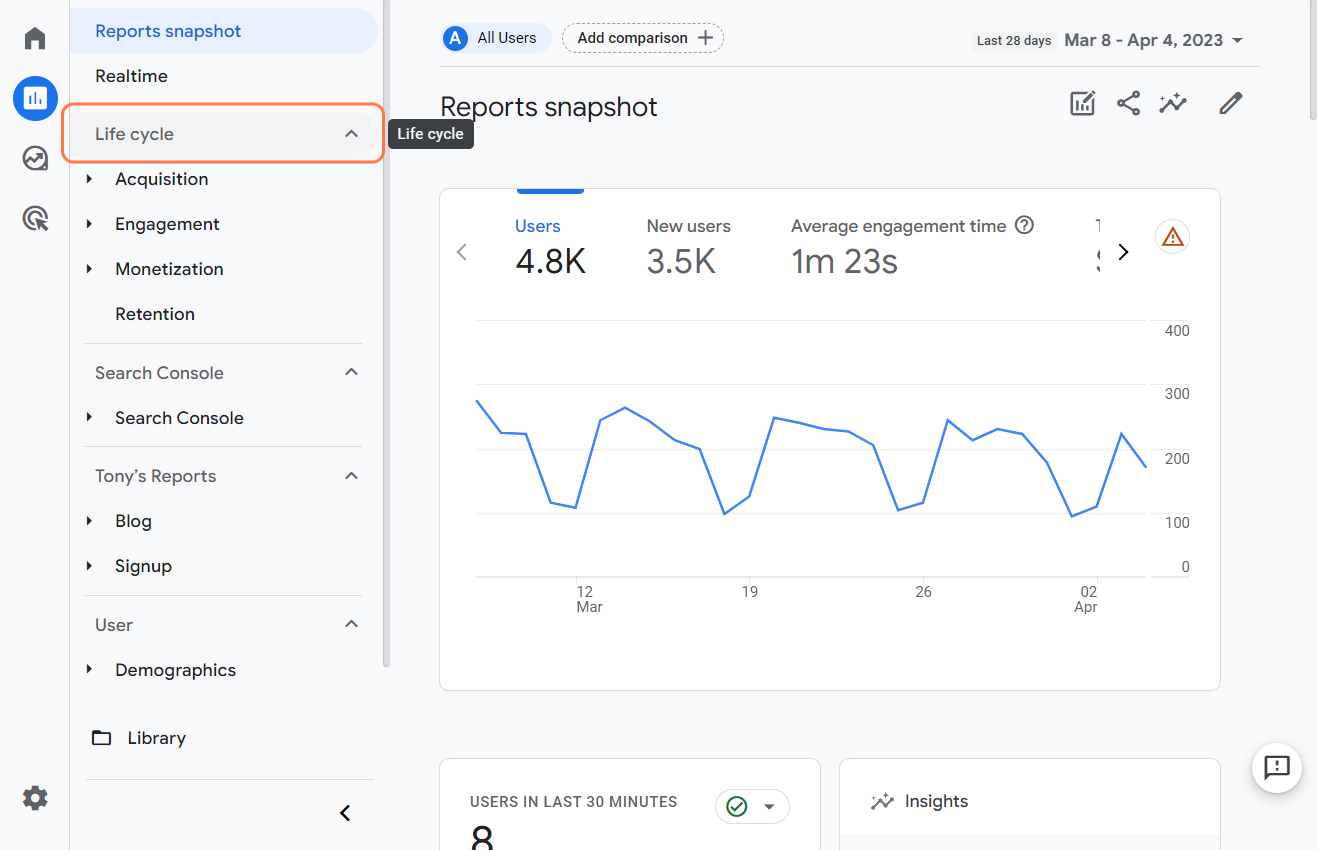
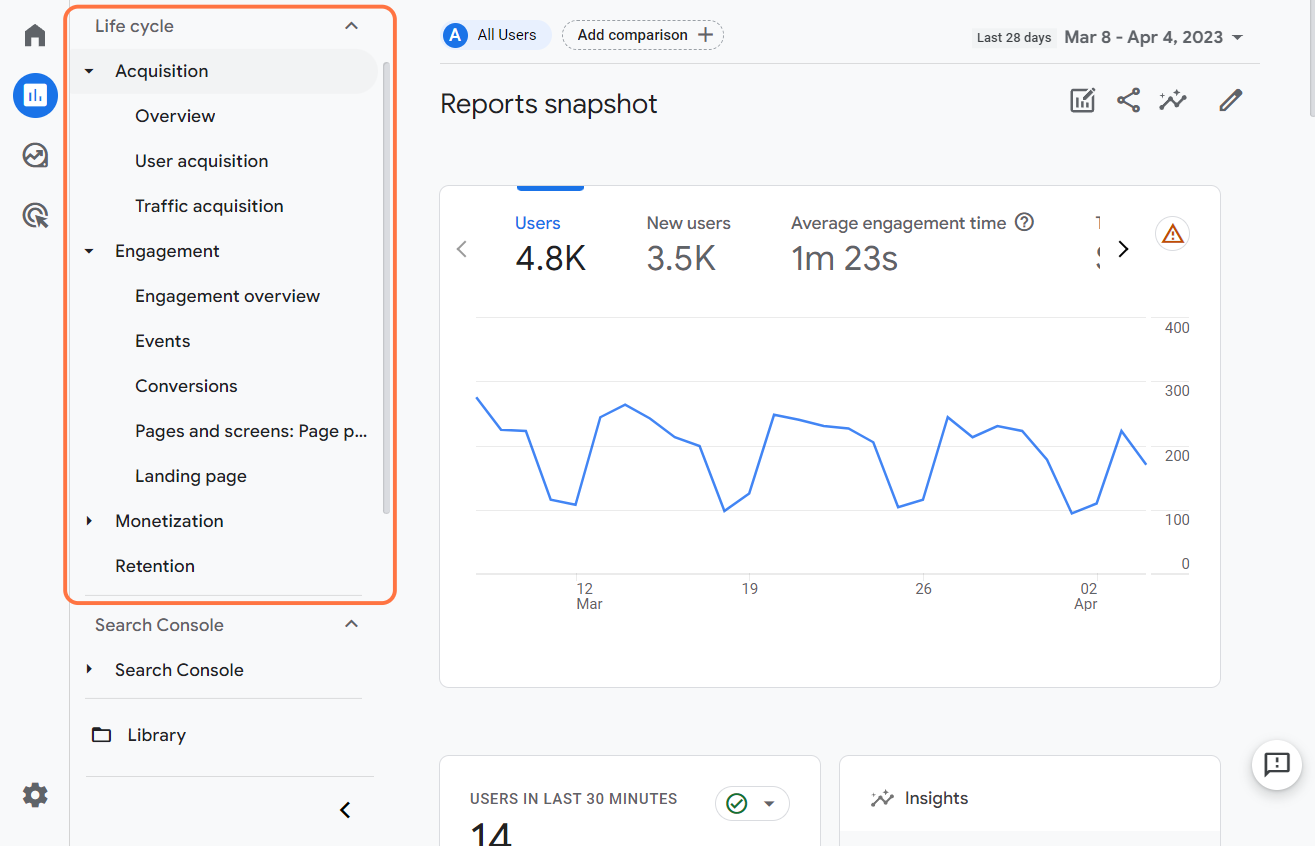
Life Cycle Reports
These reports are a powerful tool to help you measure and improve your website performance using GA4. The Life Cycle reports provide insights into how users interact with your website across various stages of their journey.
Engagement in Google Analytics 4
Each stage in GA4 has its own set of subsections that provide a deeper level of insight into your data.
You have the power to choose which metrics are most important for your specific role or business goals.
For example, understanding the Engagement section is vital for my role as a content marketing manager. By analyzing user interactions, I can make data-driven decisions, measure campaign performance, and adjust our strategies accordingly. This ultimately drives growth and success for our brand by attracting, engaging, and retaining our audience with valuable content.
The insights from the Engagement section will help you find ways to:
- improve your website,
- create better calls to action,
- and drive more traffic and conversions.
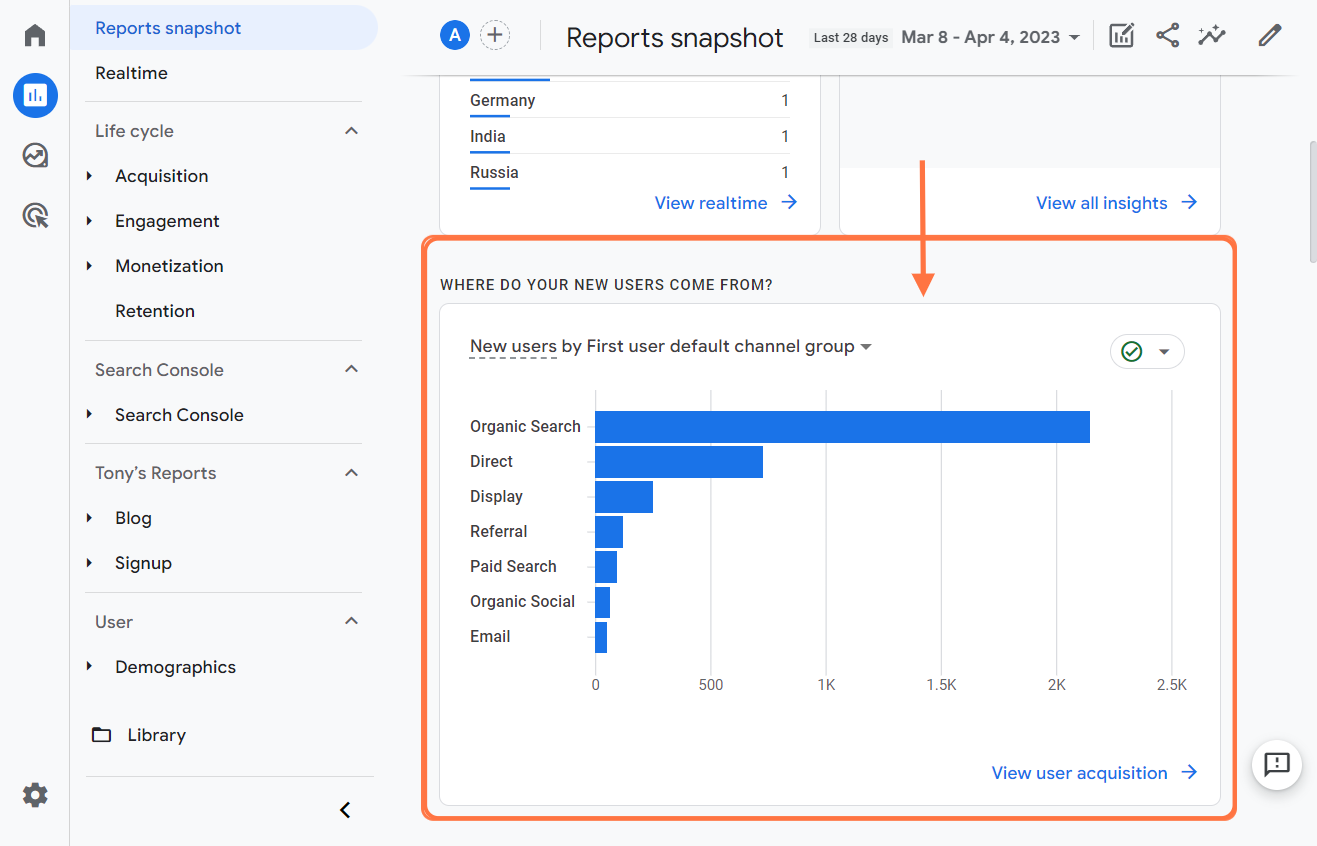
You should be interested in the Traffic Acquisition section as well.
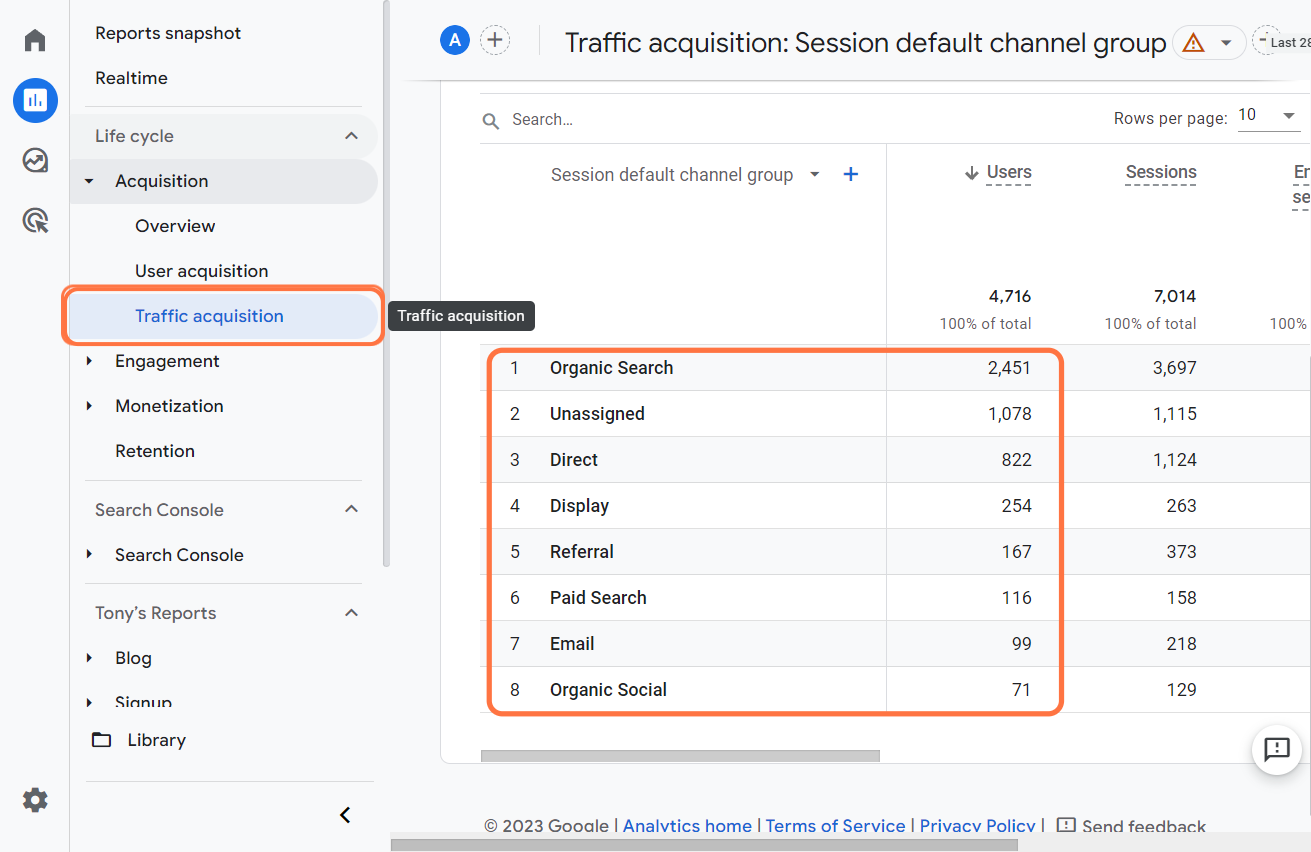
The Traffic acquisition report shows you
how people find your website
and
what channels they use to get there.
- Organic search is usually the largest source of traffic for most websites.
- Referral traffic can help you build relationships with other websites and influencers.
- Direct traffic indicates that your website has a loyal and returning audience.
User Reports
Looking to gain a more comprehensive understanding of your audience? User reports allow you to see:
- who your visitors are,
- where they come from,
- what devices they use,
- and more.
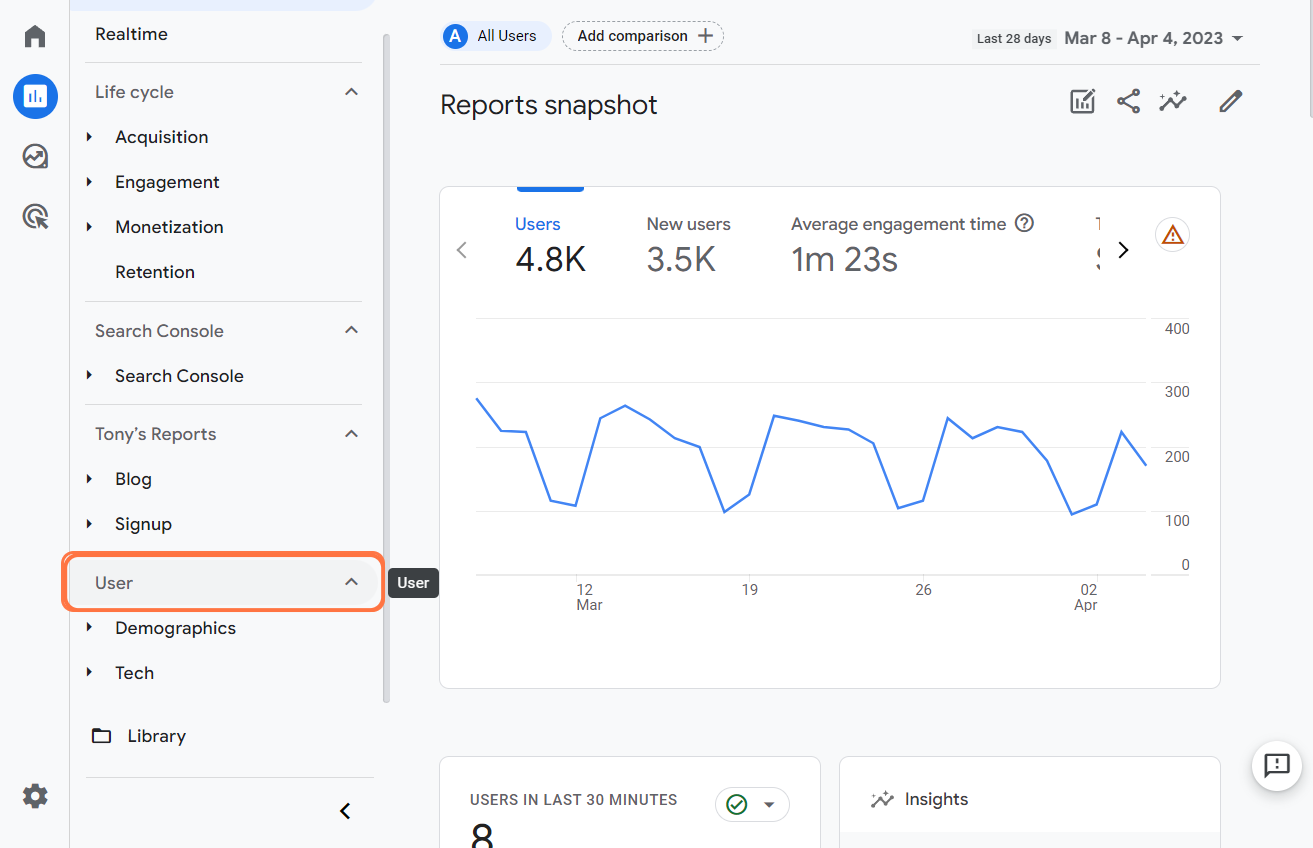
You will see a list of different reports that you can choose from, such as:
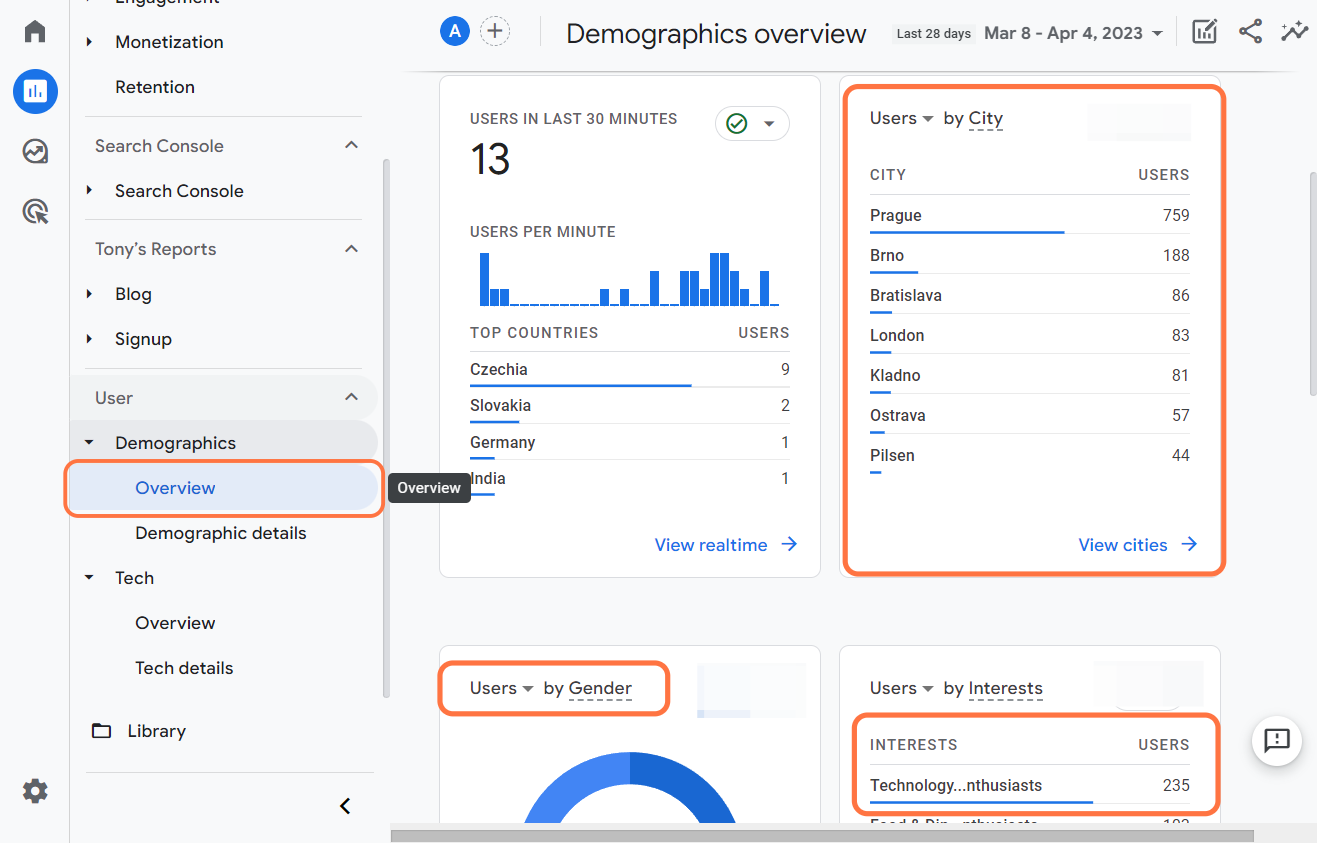
Demographics
This report shows you the age and gender distribution of your visitors.
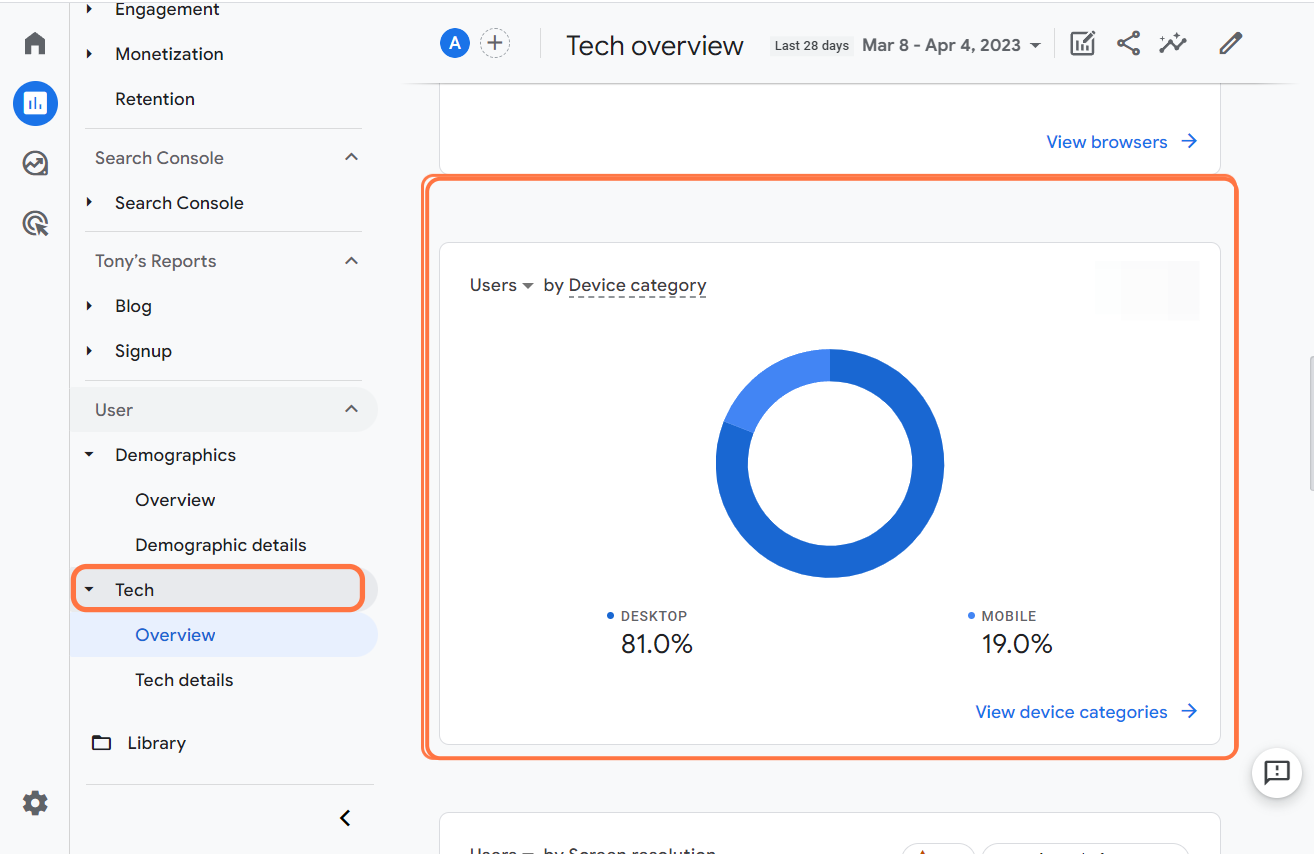
Tech
This report shows you the browser, operating system, and device type of your visitors.
Note: User reports allow you to explore a lot of other interesting reports like 'Location,' 'Behavior,' 'Interests,' and 'Custom.' These reports provide you with more insights into your audience's preferences, actions, and goals.
3. Craft Your Own Reports in Google Analytics 4
Impressive! We have certainly made great strides today. Our expedition encompassed a range of topics, including mastering the GA 4 interface and comprehending diverse report categories.
But before we part ways, there is one final piece of the puzzle: Part 4 – Creating Custom Google Analytics 4 Reports with Ease